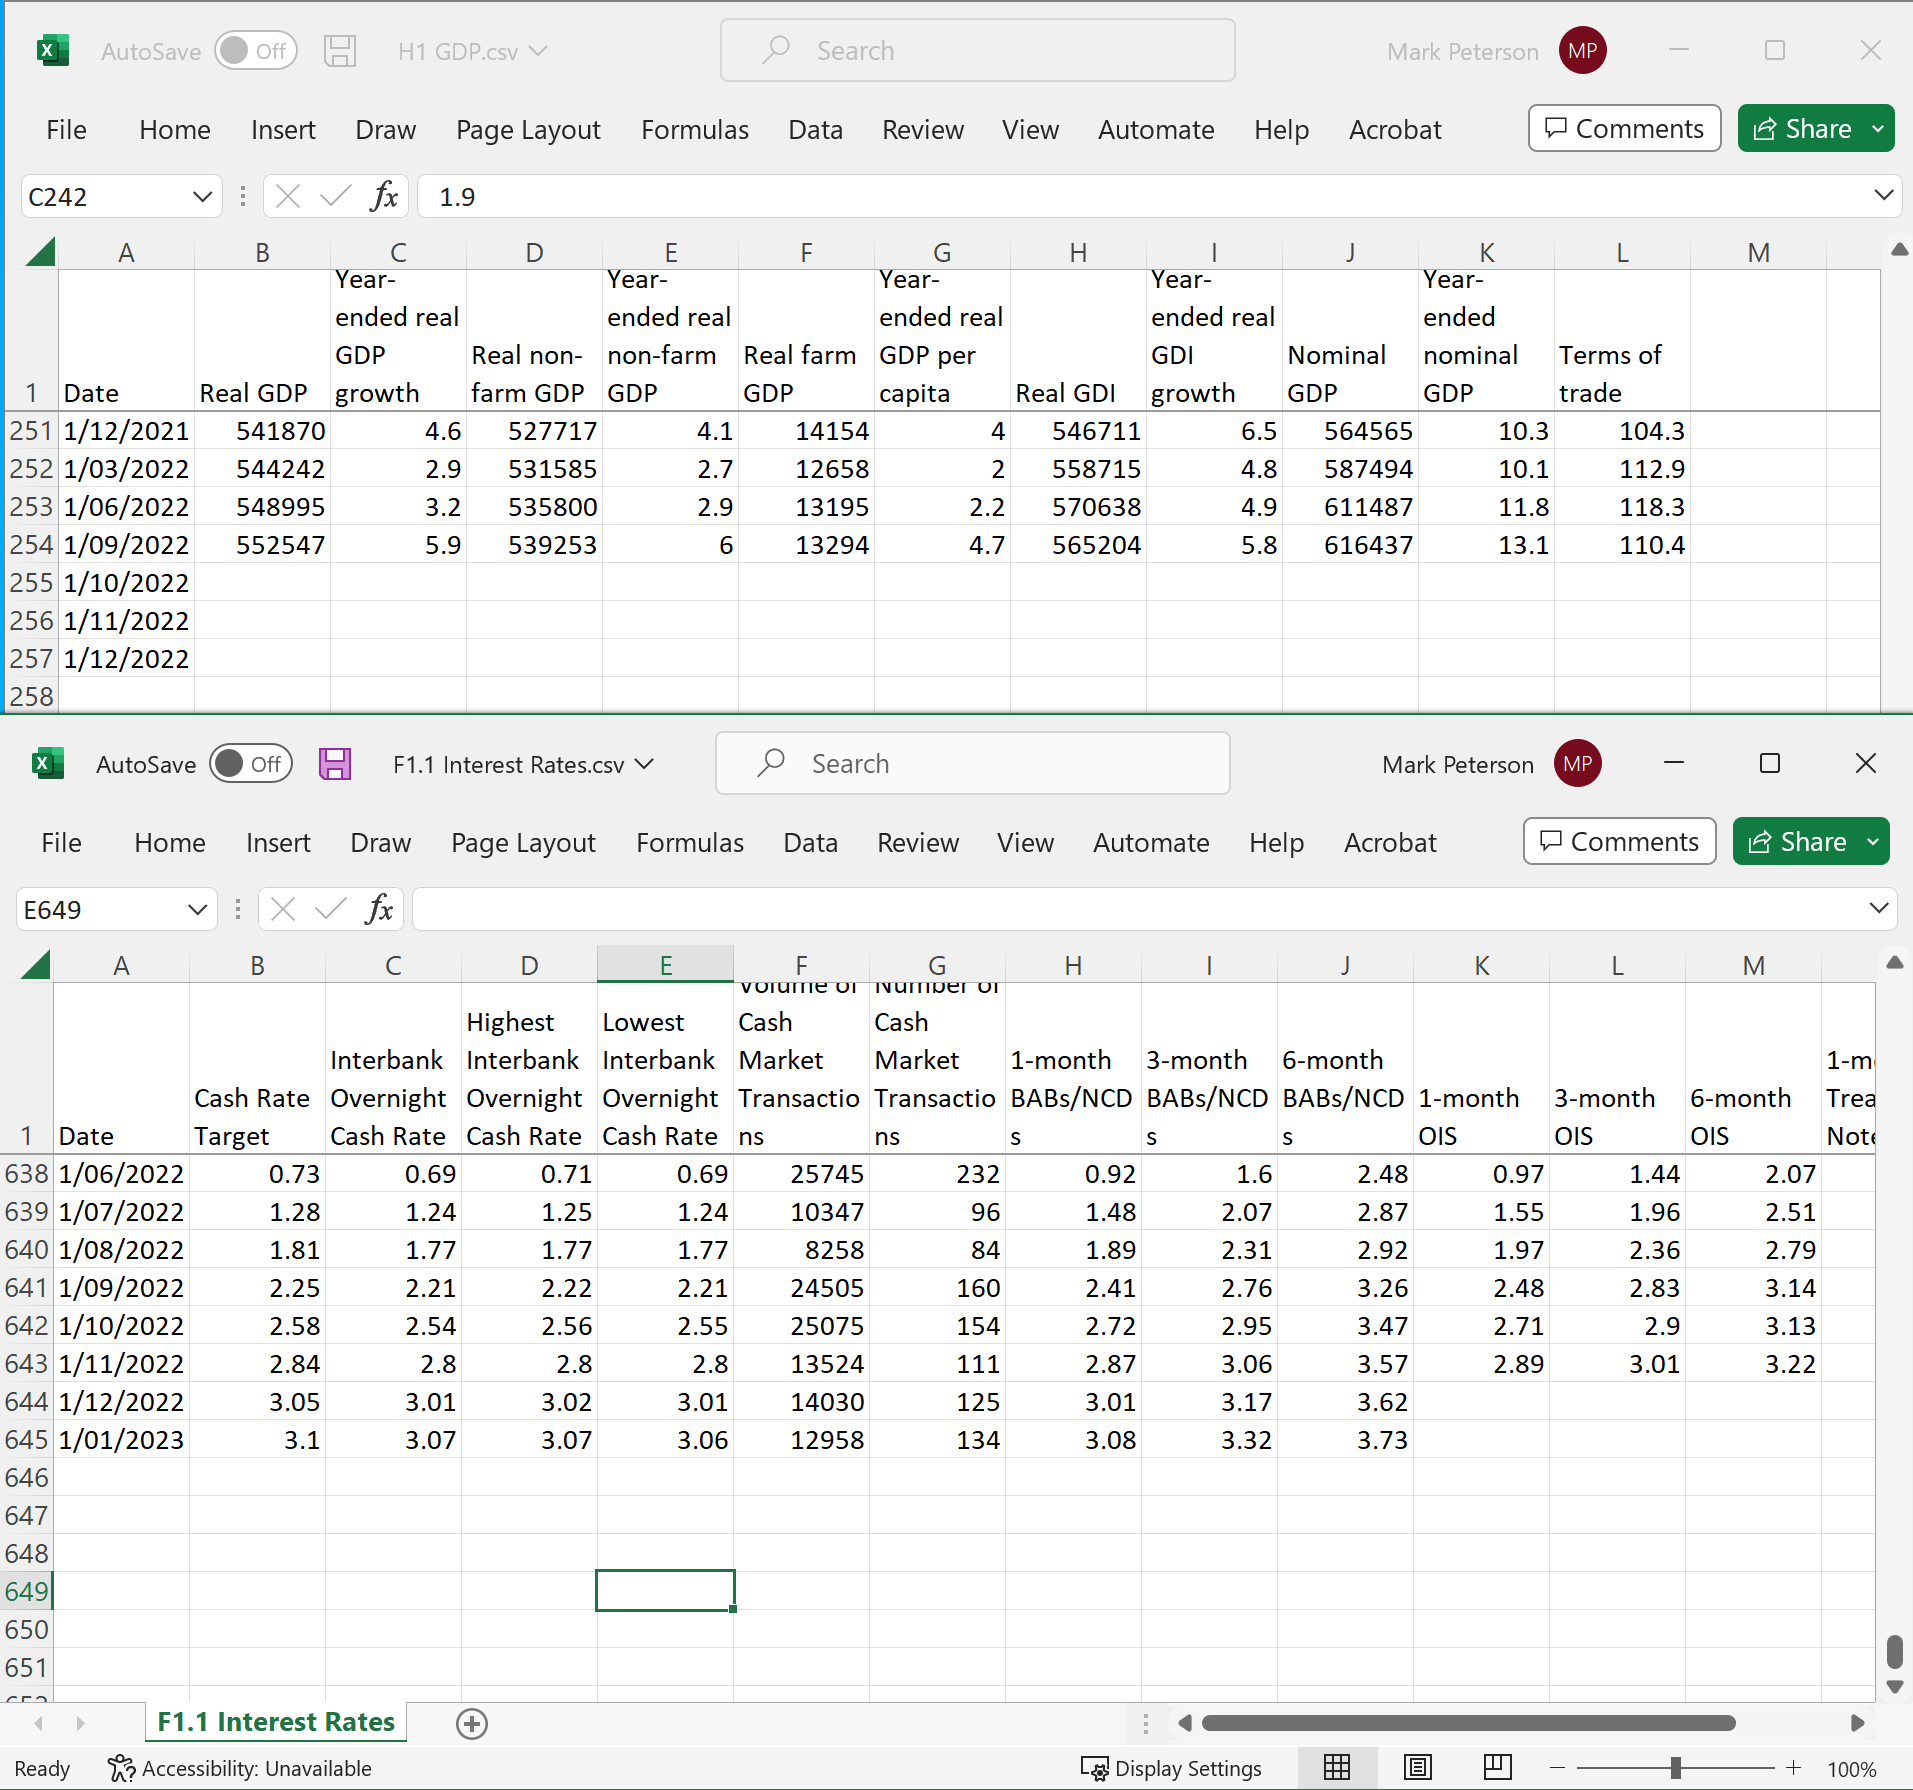
I’ve got a strange one that I’m wondering if anyone has seen and been able to find a way around. I’m trying to build a dashboard which shows headline Economic stats from various datasets. The problem is, the datasets are all updated at different frequencies, some monthly, some quarterly. The figure I’m trying to display is the “most current value” for each of the metrics. Some are current from this month (Feb 2023), others are current from last month (Jan 2023), and others are current from three months ago. Without having to configure the KPI or Metric for a “static” date, can anyone think of a way of doing this? Below screenshot shows an example of a couple of the datasets.
Best answer by Francisco Antunes
View original