Question

Malfunctioning data export (xls) from 100 % stacked graphs

  • 20 March 2024
  • 7 replies
  • 25 views

Hello,

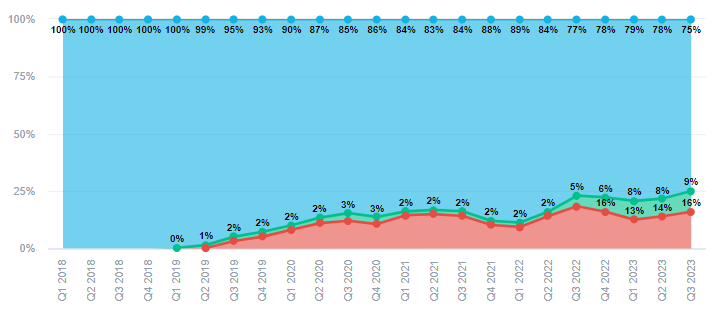
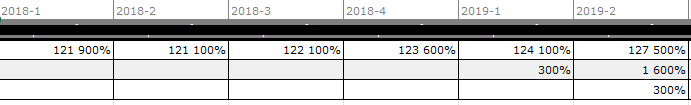
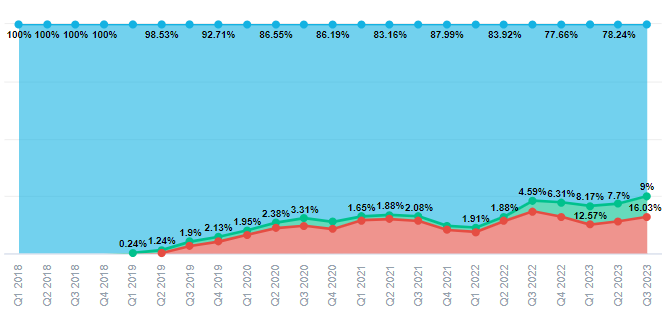
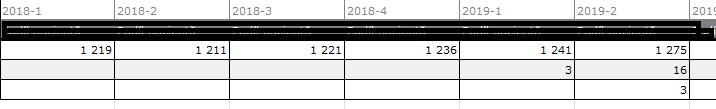
I am trying to export data from dashboards. The exported data does not correspond to what I see in a graph. It seems that numbers are completely different. It probably exports underlying data and not 100 % stacked data.


I am attaching pictures as evidence.


Thanks a lot


7 replies

Userlevel 3

Hello Anastasie, 

Exporting a visualization in XLSX format will always show the underlying data in tabular format. If you wish to see the graph instead, you will need to place the insight in a KPI dashbaord and then export it in PDF format. More details about the export options can be found in our documentation here: https://www.gooddata.com/docs/cloud/create-dashboards/export/#pdf


-Moises

Hello Moises, than you for explaining. I undestand that it shows only underlying data, but could why is data format in % then?

Userlevel 3

You’re welcome. Please note the insight format is also applied to the exported file.

Underlying data is in numeric format such as 2 135 856, but it shows 2 135 856% which is to my understanding incorrect.

Userlevel 3

If you wish to remove the formatting, it can be done from the insight metric format menu as specified in the documentation: https://help.gooddata.com/doc/enterprise/en/dashboards-and-insights/analytical-designer/work-with-metrics/format-numbers/#FormatNumbers-Definecustomnumberformats 

Thank you for explanation


Hello @Moises Morales , I looked further into this and I still see an issue.

I created a 100% stacked area chart and set up the format to Percent (rounded).

When exporting data to Excel, the data has a percent format, but it is applied not to the market share shown in the chart, but instead to the underlying data.

If I want the underlying data to have the correct format, I need to set the format to default, which is a 2-digit %. However, I want the market share to be rounded to the nearest percent.

Therefore, I can't export the data with the proper format without compromising the look of the chart.


Is there any way around this? thank you


Reply