Solved

Counting records by metric

  • 26 October 2023
  • 6 replies
  • 41 views

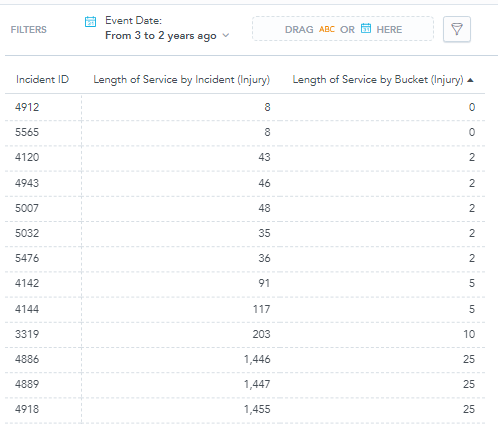
A common hypothesis is that employees with less experience are involved in more accidents. As the following image shows, I can identify specific incidents within a given time frame, I can compute the employee’s length of service (time delta between the date-of-hire and the event date), and I can properly assign the incident to a length-of-service bucket. WHat I am struggliung with is how to count the incidents in each bucket. For this example, I would like to be able to show a bar or pie chart which shows bucket ==> count:

0 ==> 2

2 ==> 5

5 ==> 2

10 ==> 1

25 ==> 3
Any ideas?

icon

Best answer by Francisco Antunes 27 October 2023, 17:18

View original

6 replies

Hi Jay,


Thanks for reaching out!

I appreciate the thorough explanation and the screenshot. I think I understand what you are looking to achieve here. Basically, you want to have a Pie/Bar chart showing the total number of injuries (each one defined by Injury ID), viewed by the Length of Service.


In this case, I think the solution would be to create a Pie/Bar chart where the Metric is the COUNT(Injury ID), Viewed by Length of Service. The results should be the count of injury per Length bucket.


Please give that a shot and let me know if it works out!


Best,

Francisco

The problem is that both the calculated length of service and the bucket are metrics, not attributes. the BY feature only works with attributes.

Thanks for the extra info! Indeed, that would not work out.


I gave it some thought, and here’s the idea I came up with:

Create a separate metric counting the Incident ID for each result or range of results from the Length of Service metric. Something like this:


SELECT COUNT (Incident ID) WHERE (SELECT Length of Service by Bucket BY Incident ID) = 1 

or
SELECT COUNT (Incident ID) WHERE (SELECT Length of Service by Bucket BY Incident ID) BETWEEN 5 AND 10


You’d end up with 4/5 such metrics (which is the downside of this method), one for each result range (defined by the WHERE conditional). Then, add all of them to the Metrics section of your Pie chart. I tested it on my end, and it should get you the results you are looking for!


Let me know if that one works out better!


Francisco

That looks like it might work, but I might not be able to test it for a day or so. Thanks.

Unfortunately, that solution does not work for me. I think the issue lies in mutilple date dimensions in play: Date (Event) and Date (Date of Hire). If I’m correct, we’ll have to rethink our data model accordingly to turn the length-of-service bucket into an attribute.

I’m sorry to hear it didn’t work out. Having Length-of-Service as an attribute would resolve this, for sure.

Feel free to let us know if you have any further questions, or run into any trouble while implementing this.


Best,

Francisco

Reply