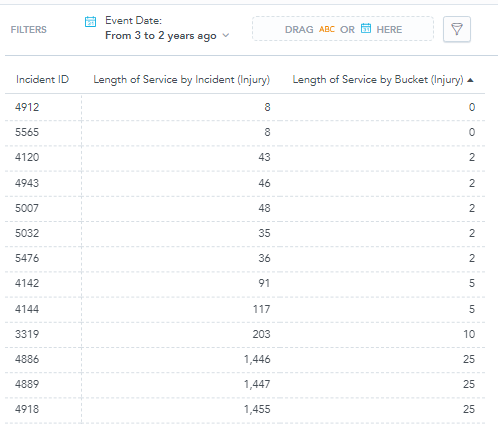
A common hypothesis is that employees with less experience are involved in more accidents. As the following image shows, I can identify specific incidents within a given time frame, I can compute the employee’s length of service (time delta between the date-of-hire and the event date), and I can properly assign the incident to a length-of-service bucket. WHat I am struggliung with is how to count the incidents in each bucket. For this example, I would like to be able to show a bar or pie chart which shows bucket ==> count:
0 ==> 2
2 ==> 5
5 ==> 2
10 ==> 1
25 ==> 3
Any ideas?
Best answer by Francisco Antunes
View original