Solved

Drilldown does not work in embeded dashboard

  • 16 October 2023
  • 12 replies
  • 96 views

Dear Community,

We have trouble with drill down functionality in our embedded dashboard.

  • We are embedding dashboard into our website via React SDK v9.2.0.
  • Implementation is very simple - <Dashboard dashboard={idRef(dashboardId)} />
  • We configured drill down to another dashboard in dashboard modeler in GoodData website.
  • Drill down to another dashboard works in GoodData website.
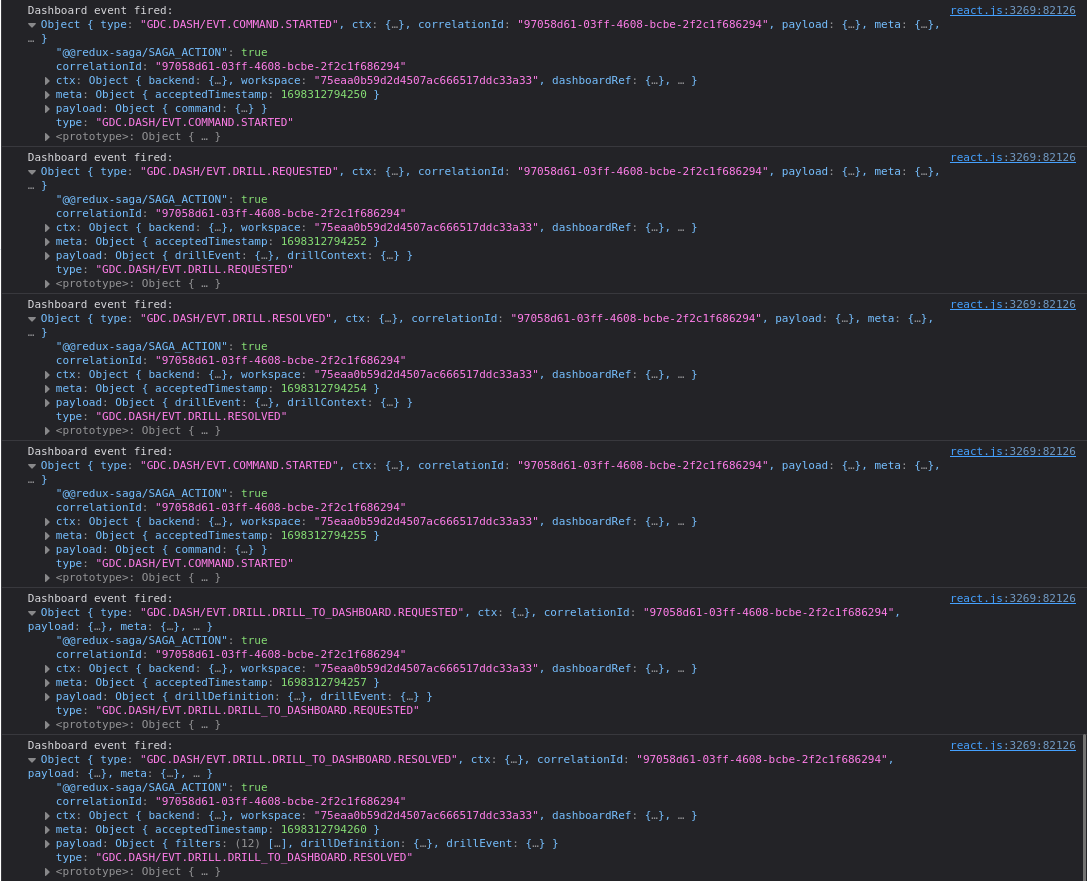
  • But it does not work in embedded dashboard.

So it seems, we miss something in configuration of embedded dashboard, do we?

Links from React UI documentation led me to this:

https://help.gooddata.com/doc/growth/en/expand-your-gooddata-platform/gooddata-integration-into-your-application/embed-gooddata-elements-into-your-applications/setting-up-events-for-drilling-in-embedded-analytical-designer-and-dashboards/#SettingupEventsforDrillinginEmbeddedAnalyticalDesignerandDashboards-DrillEventingversusDrillintoDashboard

It’s under GD Platform documentation, so I’m not sure if is it relevant for Cloud too? Also it seems to be relevant for embedding via iframe.

It is worth mentioning that we have another dashboard where we use drill down to insight and it works fine in embedded dashboard.

May I ask you to help us to figure out what’s wrong or what we missed in embedded dashboard configuration?

Many Thanks.

Tomas Hoch

icon

Best answer by Radek Nováček 3 November 2023, 16:24

View original

12 replies

Userlevel 3

Hello Tomas, 

Could you provide details about the error you are seeing when attempting the drill? Is there a TraceID available, or some error on the screen itself?


Also, this is difference in the documentation from Platform and Cloud: 


https://www.gooddata.com/developers/cloud-native/doc/cloud/embed-visualizations/web-components/

Hi Joseph,

I do not see any error. Click does not trigger any action, no requests in network, no errors on the screen nor in console.

And it happens only for embbeded dashboard. In dashboard in GoodData website click redirects me to the target dashboard and everything works as expected.

Userlevel 3

Hi Tomas, 

Could you please make sure you have set up the following: 

https://help.gooddata.com/doc/enterprise/en/expand-your-gooddata-platform/gooddata-integration-into-your-application/embed-gooddata-elements-into-your-applications/setting-up-events-for-drilling-in-embedded-analytical-designer-and-dashboards/

Hi Joseph,

I came across the article. I noticed that it mention that:

By default, if your embed a dashboard that includes insights with the Drill into dashboard set, the list of drillable items you send is ignored for these particular insights.

I saw, it’s part of GoodData Platform documentation and it seems that it’s related embedding dashboards via iframe, isn’t? Or is it also relevant for GoodData Cloud and embedding via React?


If is it relevant also for GoodData Cloud and embedding via React, do you know how to implement the same thing like set “preventDefault=true” in URL when using React for embedding?


I was also digging in code in React, but I haven’t found any option how to achieve that. It does not mean, it’s not there. I just gave up and try my luck here.


Thank you for helping me with that.


Tomas

Userlevel 3

Hi Tomas, 

That link I had provided for the documentation is relevant for cloud as well. It should help following those steps, but if you are still facing issues we can explore further with our engineers on our end. 

Hi Joseph,

Yes please, it would be very helpful. I still do not know how to set similar option like “preventDefault=true” in React component.

Thank you very much!

Userlevel 3

Hi Tomas, 


Could you please try and add an event listener to see what the console output after clicking would be? You can make the following change:

 
        <Dashboard
dashboard={dashboardRef}
eventHandlers={[
anyEventHandler((e) => {
console.log("Dashboard event fired:", e);
}),
]}
/>


and extended import:

import { Dashboard, anyEventHandler } from "@gooddata/sdk-ui-dashboard";


Hi Joseph,

I added event handler as you suggested and there are several events after clicking:


Is it correct? I can provide more detailed info on any of these events if you need it. Please let me know.

Userlevel 1

Hi Tomáši,

Radek from the GD technical team here!

The event listener was intended to try and see if anything is actually happening on click, or if it’s ignored completely - judging by the fact that the first drill resolved and started a drill_to_dashboard, this part is good at least.

Could you share what the drill_to_dashboard.resolved object actually contains? 

Many thanks!

Hello Radek,

Entire object has more than 8000 rows and contains sensitive information like tokens.

So here is the sample of the object:

{
"type": "GDC.DASH/EVT.DRILL.DRILL_TO_DASHBOARD.RESOLVED",
"ctx": {
"backend": //...,
"workspace": "75eaa0b59d2d4507ac666517ddc33a33",
"dashboardRef": {
"identifier": "afb243cc-76d1-455e-81c6-94e281125575"
}
},
"correlationId": "adab13a6-8731-4816-bfc1-99f31929b731",
"payload": {
"filters": //...,
"drillDefinition",: {
"transition": "in-place",
"origin": {
"type": "drillFromAttribute",
"attribute": {
"localIdentifier": "b9598fc4de344c2ea3558a5edcaabe59"
}
},
"type": "drillToDashboard",
"target": {
"identifier": "923f543e-23aa-4813-8cb0-6f57c0873b8d",
"type": "analyticalDashboard"
}
},
"drillEvent": {
"dataView"://...,
"drillContext": {
"type": "table",
"element": "cell",
"columnIndex": 4,
"rowIndex": 10,
"row": //...,
"intersection": //...
},
"widgetRef": {
"identifier": "941c058f-6b70-4b0f-b1b7-e8fe637b6647_widget-0",
"uri": "941c058f-6b70-4b0f-b1b7-e8fe637b6647_widget-0"
},
"drillDefinitions": [
{
"transition": "in-place",
"origin": {
"type": "drillFromAttribute",
"attribute": {
"localIdentifier": "b9598fc4de344c2ea3558a5edcaabe59"
}
},
"type": "drillToDashboard",
"target": {
"identifier": "923f543e-23aa-4813-8cb0-6f57c0873b8d",
"type": "analyticalDashboard"
}
}
]
}
},
"meta": {
"acceptedTimestamp": 1698406778043
}
}

Do you interested in any particular part? I can provide more info. Please tell me, which properties carries crucial information for debugging.


Thank you for helping me with that.

Userlevel 1

Hi Tomáši,

Sorry for the delay, I was out on sick leave!

The purpose behind this was to check if the calls are being sent, and if the returns are correct - and both is true in this case, which is something at least. In practice, to fix this, you can capture the events sent and use those to display the correct dashboard in the Dashboard component; we have a very nice example of how to do this up in our Component library: Drill-to-dashboard example.

Can you have a look if that’s useful for your implementation as well?

Best regards,
Radek

Dear Radek,

The page with examples was more than useful, priceless! Not only for this particular drill-down dashboard issue, but there are other nice examples and ideas, which will be useful later. This page is exactly what I was looking for. Many thanks for that.

I was thinking, why I didn’t discover that by myself and I found out it’s named as “Gallery”. In my opinion, it would be more intuitive as a part of “Example” page (which I found) or just with more intuitive name. Also mentions with links in main documentation would be also helpful. I want to share this feedback with you, because I was searching for such a page with implementation examples really thoroughly I think.

Anyway, thank you for your help. It’s solved from my side.

Regards,

Tomas Hoch

Reply