
This article explains how to use MAQL to calculate the relationship between two variables in terms of covariance, Pearson correlation, and the R-squared coefficient of determination.
To learn about statistical functions in MAQL, see our Documentation.
Background
Covariance
In probability theory and statistics, covariance is a measure of the degree to which two random variables (X, Y) change together. If the variables tend to show similar behavior, the covariance is positive. In the opposite case, when the greater values of one variable mainly correspond to the smaller values of the other, the covariance is negative.
Covariance is calculated as

Pearson Correlation (r)
In statistics, correlation is the degree of association between two random variables (X, Y). It is expressed by a correlation coefficient that varies between -1 and 1.
Correlation is calculated as

where sx is the standard deviation of X.
R-Squared (Coefficient of Determination)
In statistics, R-Squared (the square of the Person Correlation Coefficient) indicates how well data points fit a line or curve. It is mainly used in models that predict future outcomes or test hypotheses on the basis of other related information.
R-Squared is calculated as

Scenario
Suppose that an insurance company wants to find the relationship between the number of claims and the value of those claims, organized by Geo Codes.
Sample Data
| Geo Codes | Number of Claims (X) | Value of Claims in $K (Y) |
|---|---|---|
| 11011 | 108 | 392.5 |
| 11012 | 19 | 46.2 |
| 11013 | 13 | 15.7 |
| 11014 | 124 | 422.2 |
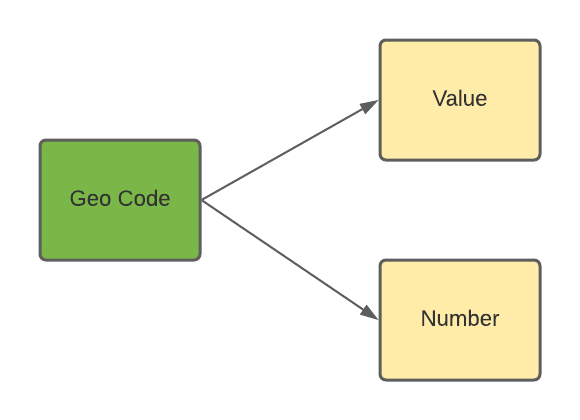
Our data set contains Number and Value facts by Geo Code as depicted by the following model:
Metric 1 - Avg Claim Number (Mean X)
To find the average of variable X, or Avg Claim Number, you can use MAQL to define the following metric:
SELECT AVG(Number) BY ALL OTHER
The BY ALL OTHER clause is used to avoid any slicing of the amount by anything that may be present in the report.
Metric 2 - Avg Claim Value (Mean Y)
You can define a similar metric to find the average of variable Y, or in this case Avg Claim Value:
SELECT AVG(Value) BY ALL OTHER
The BY ALL OTHER clause is used to avoid any slicing of the amount by anything that may be present in the report.
Metric 3 - Claim Number Diff
You can now use the metric created in Metric 1 to calculate the difference between any given number of claims and the overall average claim number. Note that this metric is sliced by Geo Code:
SELECT SUM(Number - Avg Claim Number) BY GeoCode
Metric 4 - Claim Value Diff
Likewise, you can use Metric 2 to calculate the difference between any given claim value and the overall average claim value:
SELECT SUM(Value - Avg Claim Value) BY GeoCode
Metric 5 - Covariance
Next you can calculate the covariance by multiplying the two difference metrics that were defined in Metrics 3 and 4, aggregating the result, and dividing by the number of records (n):
SELECT (SELECT SUM((SELECT Claim Number Diff*Claim Value Diff BY GeoCode)))/ (SELECT COUNT((GeoCode)))
To determine the number of records, you have counted the number of unique Geo Codes.
Metric 6 - Pearson Correlation (r)
Now that you have calculated the covariance, you can calculate the correlation by dividing the value by the standard deviation of X and Y, or in this case, Number and Value facts:
SELECT Covariance(Number, Value) /((SELECT STDEV(Number))*(SELECT STDEV(Value)))
Metric 7 - R-Squared
R-Squared is the square of the Pearson correlation, which you already calculated in Metric 6:
SELECT POWER(Pearson Correlation (r), 2)
Note that in this case, using the POWER function with exponent 2 has the same effect as squaring the Pearson Correlation (r) metric, or multiplying it by itself.
By nesting MAQL metrics, you can create complex statistical expressions with little of the complexity you'd expect from a data query language.