You can enable or disable an axis in column, line, bar and combo charts.
Steps:
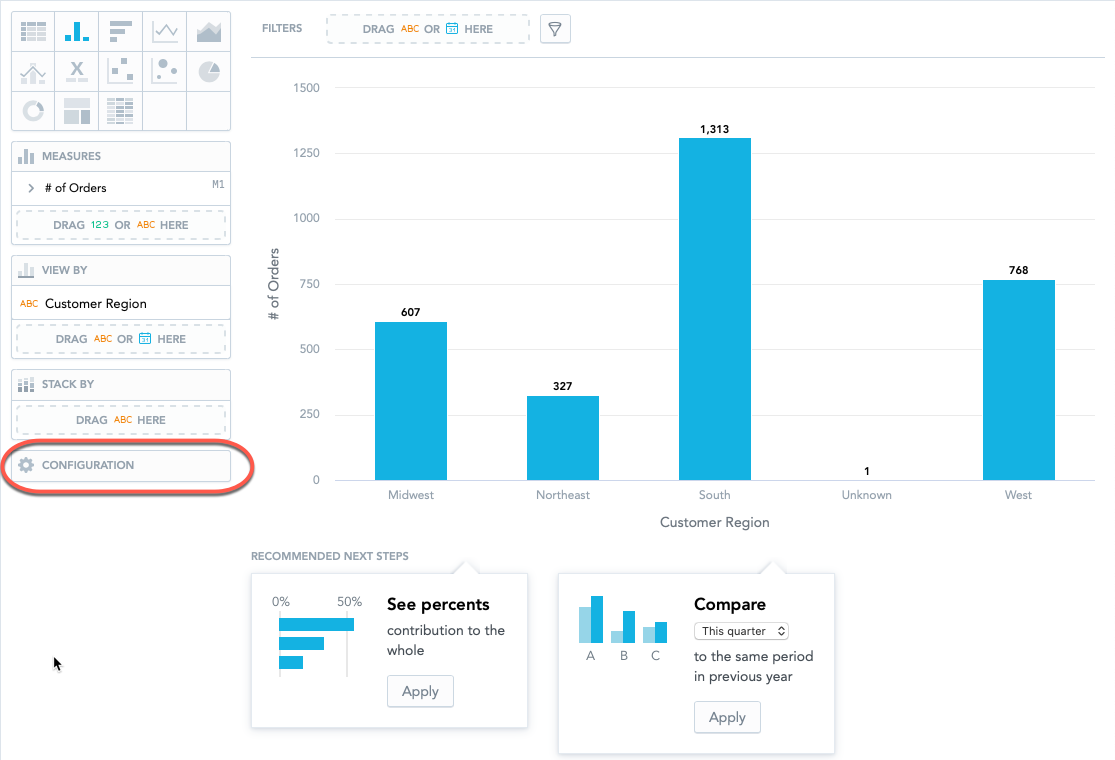
- In Analytical Designer (the Analyze tab), click Configuration.
- Toggle the axes settings.
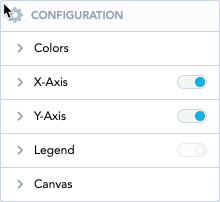
- To display or hide axes, toggle the switch for Y-Axis.
If secondary axes is enabled for bar chart, column charts or line charts, you can configure the secondary axis here as well.
Note: Feel free to explore the Colors, Legend, and the Canvas options.
For general information about customizing your insights, see Configure Insight Properties.