Introduction
This article will review how to integrate — not embed — GoodData analytics into your application using JavaScript. For embedding, we generally use iframes and you can read about it here. While direct integration may take a few more steps to set up, it comes with more than a few benefits: Faster initial load, easy communication between the embedded integrated component and the rest of the application, no CORS or 3rd party cookies issues, and no additional authentication or SSO setup.
WARNING: The DashboardView component has been superseded by the newer Dashboard component. The DashboardView component has been deprecated. The newer Dashboard component does not accept filters property and works with store accessors instead.
What’s the story?
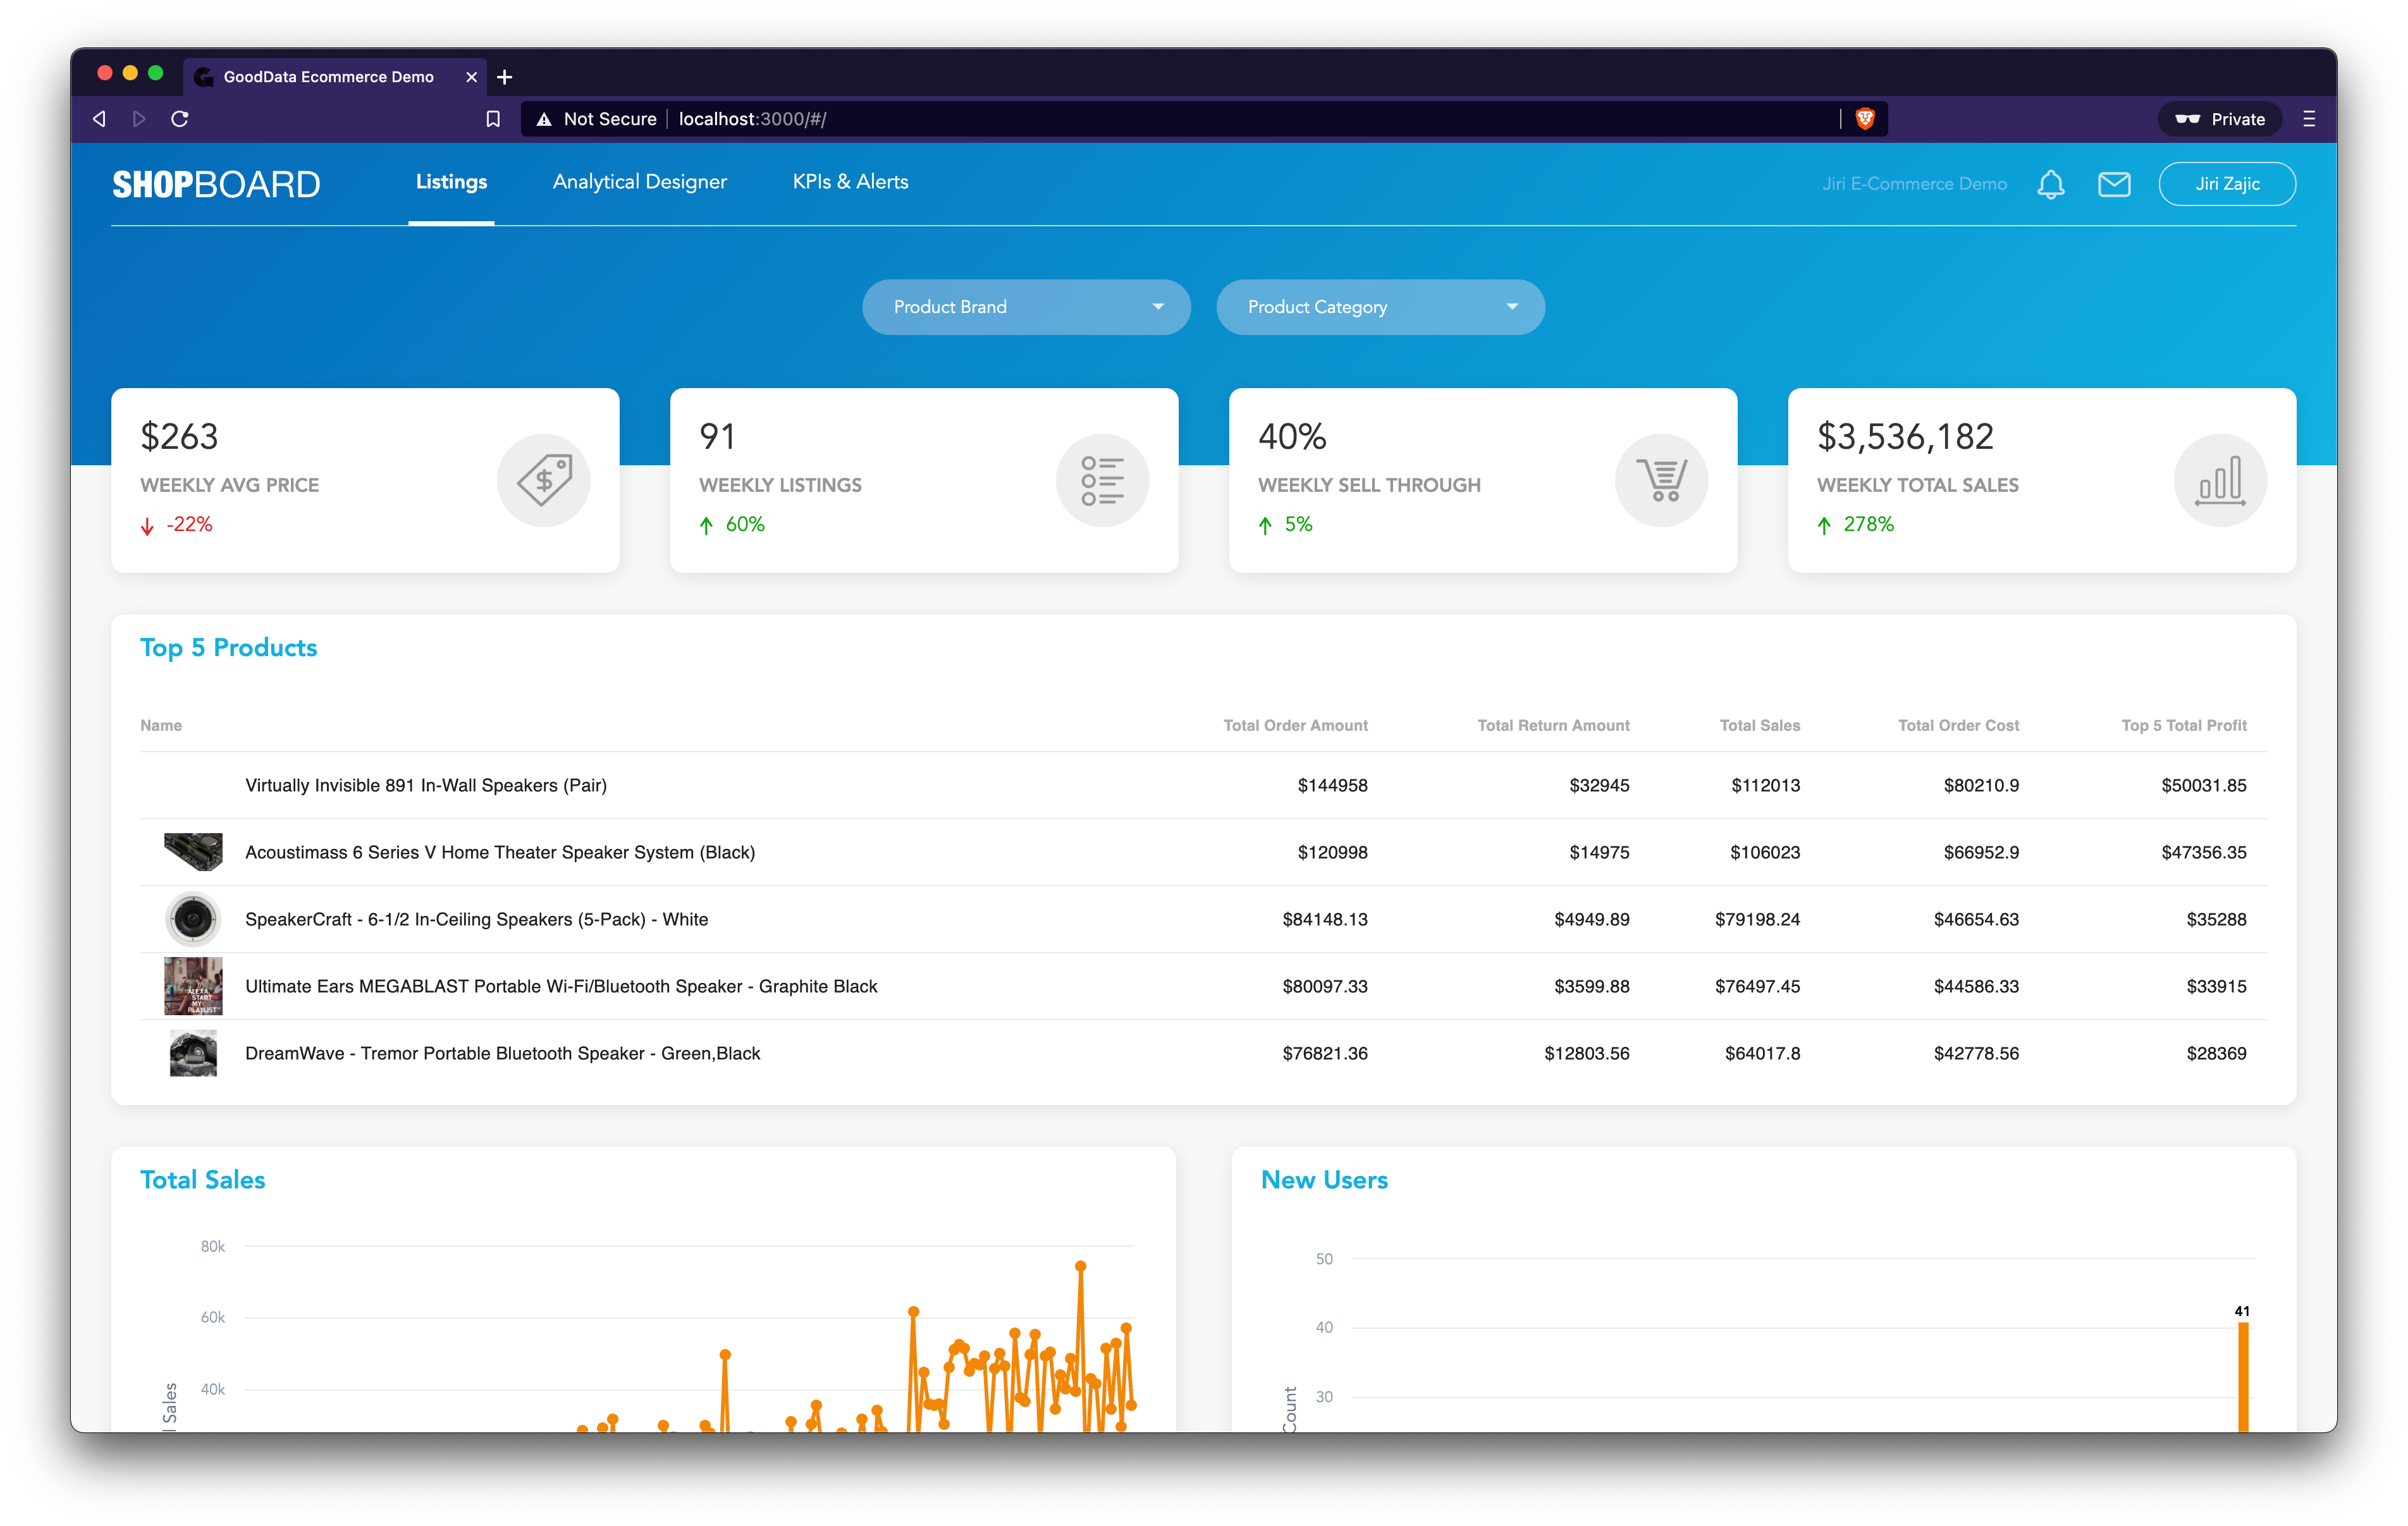
Let’s assume there’s an application with a particular look & feel that your users are accustomed to. It contains some basic charts and works fine, but any time your PMs or customers request a change, you need developers to change the code, which often takes quite a lot of time and effort. What you need is a simple to use GUI that will allow anybody – even your customers – to make the changes easily.
This exercise aims to replace the hardcoded table and the two charts with an integrated Dashboard that is customizable while maintaining the same look & feel and preserving the filtering capabilities of the whole environment.
Implementation
This could be a very simplified source code of the current state of the application:
<MyPage>
  <AttributeDropdown attribute={PRODUCT_BRAND} />
  <AttributeDropdown attribute={PRODUCT_CATEGORY} />
  <Kpi measure={AVG_PRICE_OF_PRODUCTS} />
  <Kpi measure={TOTAL_LISTINGS} />
  <Kpi measure={PERC_SELL_THROUGH} />
  <Kpi measure={TOTAL_SALES} />
  <CustomTable />
  <LineChart />
  <ColumnChart />
  <GeoPushpinChart />
</MyPage>
To replace the main hardcoded insights on the page with the integrated dashboard, we need to roughly do the following:
<MyPage>
  <AttributeDropdown attribute={PRODUCT_BRAND} />
  <AttributeDropdown attribute={PRODUCT_CATEGORY} />
  <Kpi measure={AVG_PRICE_OF_PRODUCTS} />
  <Kpi measure={TOTAL_LISTINGS} />
  <Kpi measure={PERC_SELL_THROUGH} />
  <Kpi measure={TOTAL_SALES} />
  <DashboardView dashboard={DASHBOARD_ID} />
</MyPage>
After a few necessary CSS adjustments, our application could look like this:
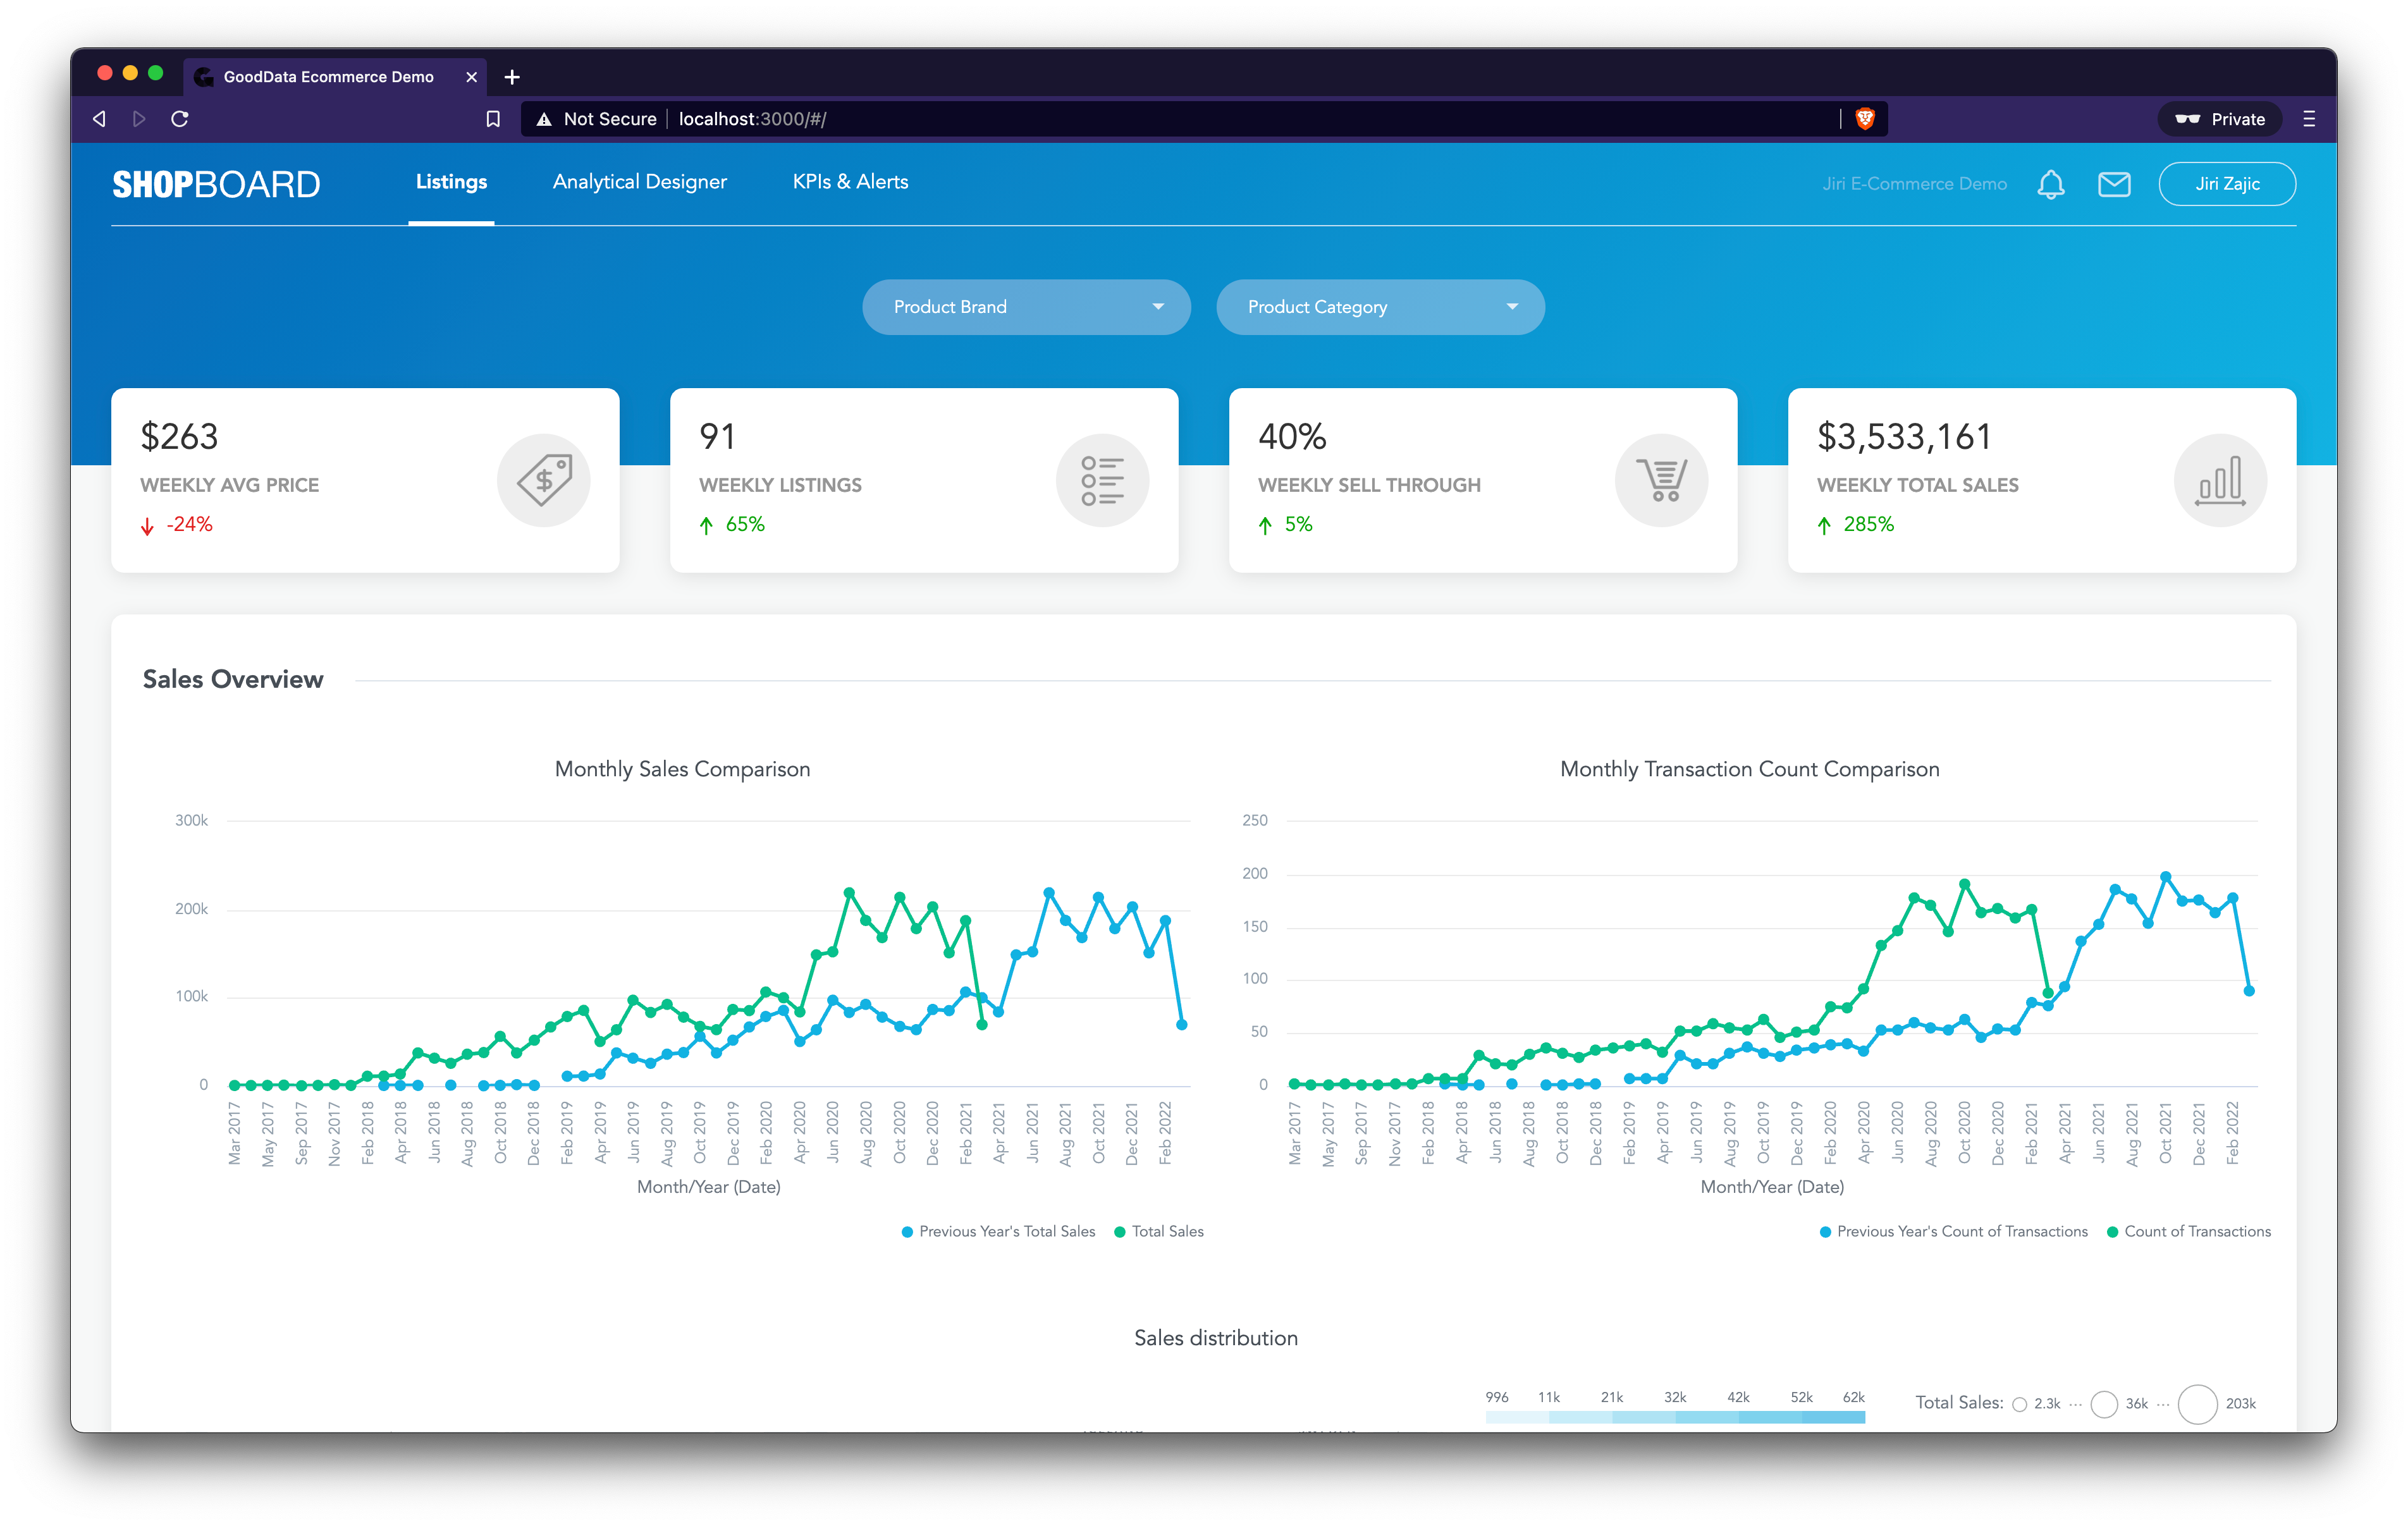
Now we need to connect the filters at the top of the page to the integrated dashboard. This is actually a trivial task, since the DashboardView component accepts a filters property the same way other components do:
<Kpi measure={AVG_PRICE_OF_PRODUCTS} filters={filters} />
<Kpi … filters={filters} />

<CustomTable filters={filters} />
<LineChart filters={filters} />
<ColumnChart filters={filters} />
<GeoPushpinChart filters={filters} />

<DashboardView dashboard={DASHBOARD_ID} filters={filters} />
Every time Product Brand and Product Category filters are used, they will get propagated and applied to the integrated dashboard as well.
Conclusion
Embedding Integrating KPI Dashboards is straightforward and easy! Check our documentation to learn more about the Dashboard component capabilities: https://sdk.gooddata.com/gooddata-ui/docs/dashboard_component.html.