New Features
Geo Charts (Pushpins) - New Visualization Type in Analytical Designer
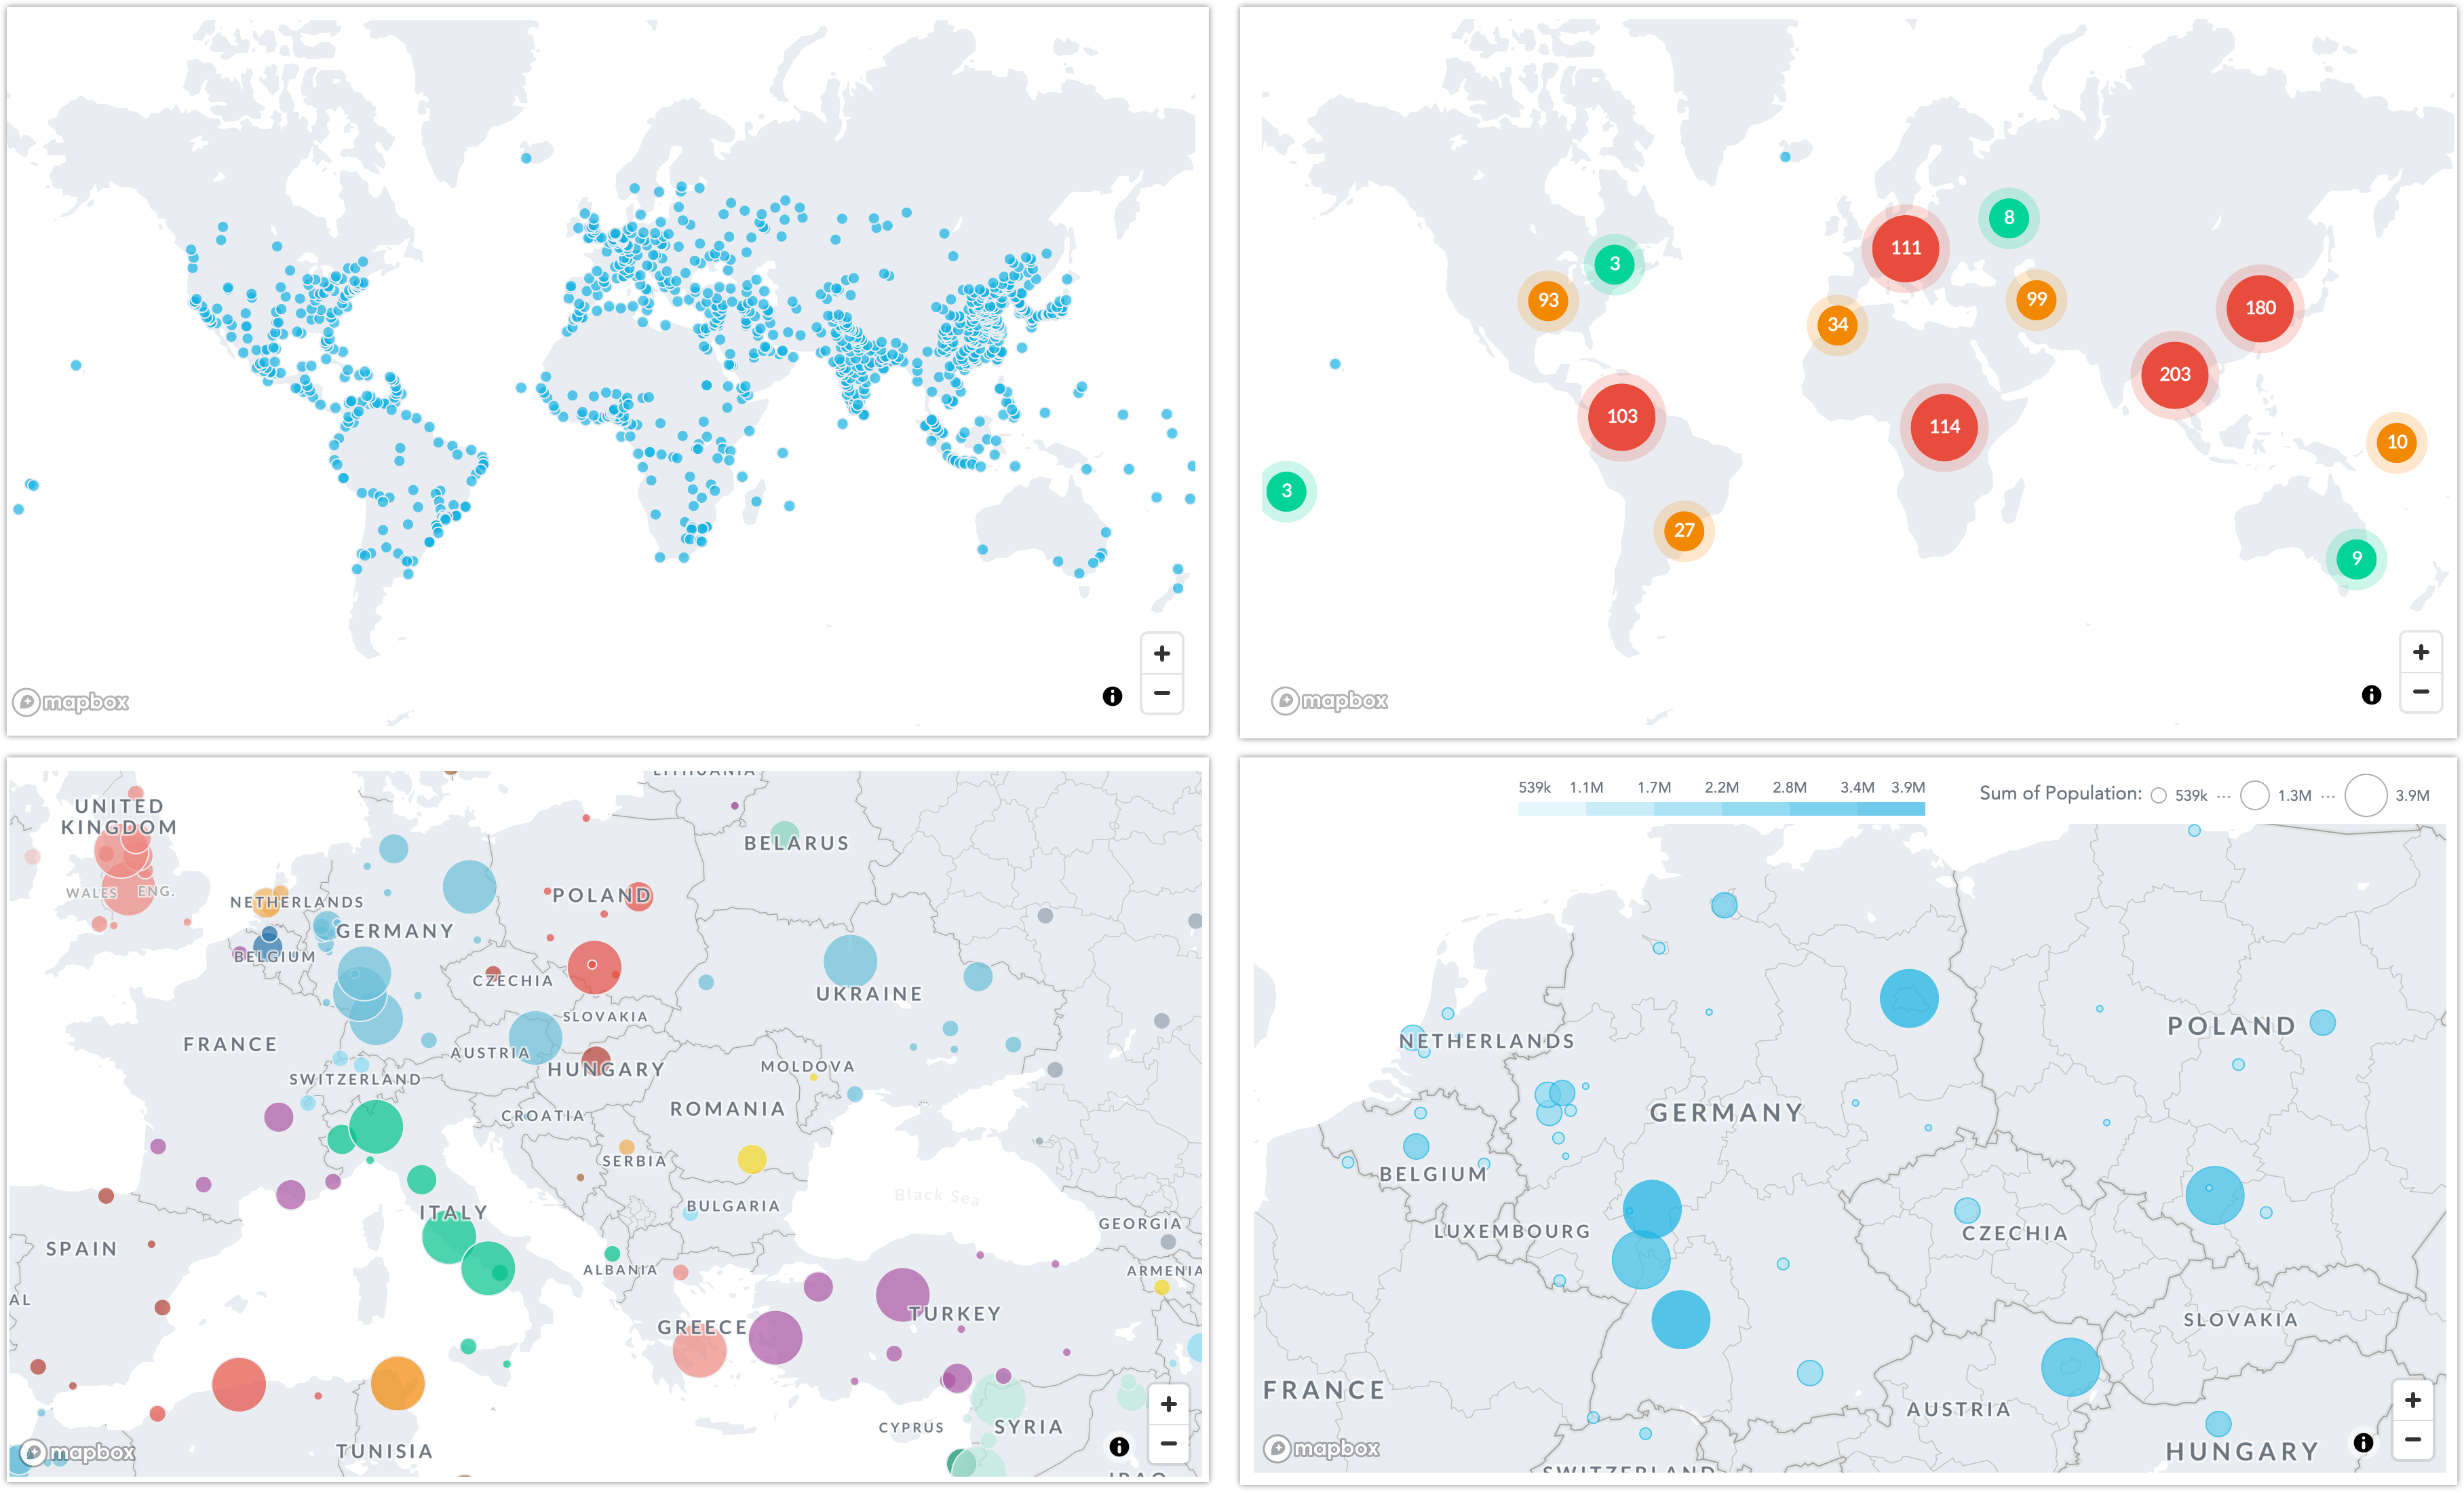
Analytical Designer now offers a new type of visualizations - Geo charts (pushpins).
Geo charts with pushpins show data points as bubbles. They use location coordinates to display your data distributed on a world map. You can change the size and the color shade of the pushpins based on metric values.
In the configuration, you can select which part of the map will be displayed as default, change the color of the pushpins, adjust the size ratio of the min and max pushpins, or group nearby points for better orientation.
Learn More:
Geo Charts (Pushpins)
Configure Data for Geo Charts
Export Dashboards to PDF (Beta)
Dashboards now enable you to export a whole dashboard to a PDF file.
The exported PDF file includes all visualization together with the dashboard name, date of the export, and page numbers.
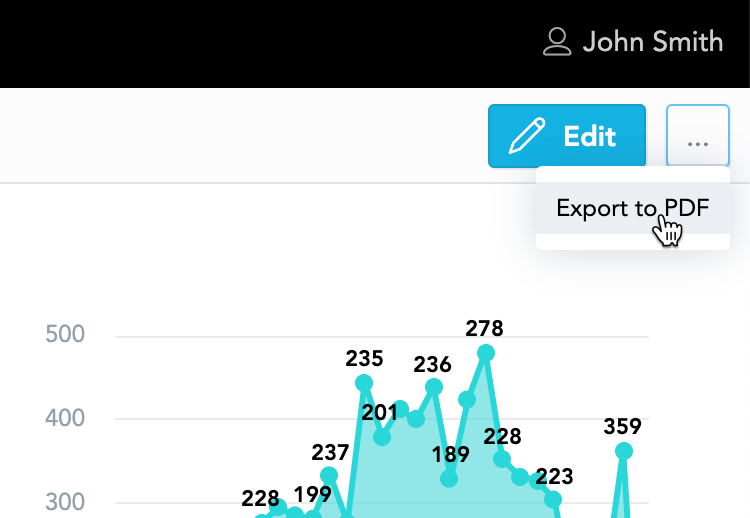
NOTE: PDF exports are available as a beta feature. We are still finalizing the implementation, however, it is available for you to try.
Learn More:
Clearing Cache Manually
You can now force a cache refresh for a given data source directly from the Data Sources tab.
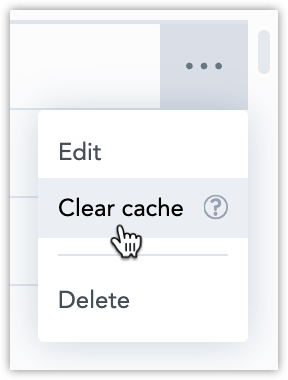
We hope this option will make prototyping and testing your analytics easier, but in production we still recommend you set up an automated process that clears the Data Source’s cache automatically by calling the API endpoint /uploadNotification.
Learn More:
Reload Cached Data
Support for AWS PrivateLink
We are now able to set up AWS PrivateLink with GoodData Cloud. If you have an AWS account that runs an Amazon Redshift database, you can privately tunnel your data directly to your GoodData analytics. Though the initial setup will require some work on your end, as well ours. Refer to this article on our Community portal for the details.
Learn More:
Using AWS PrivateLink
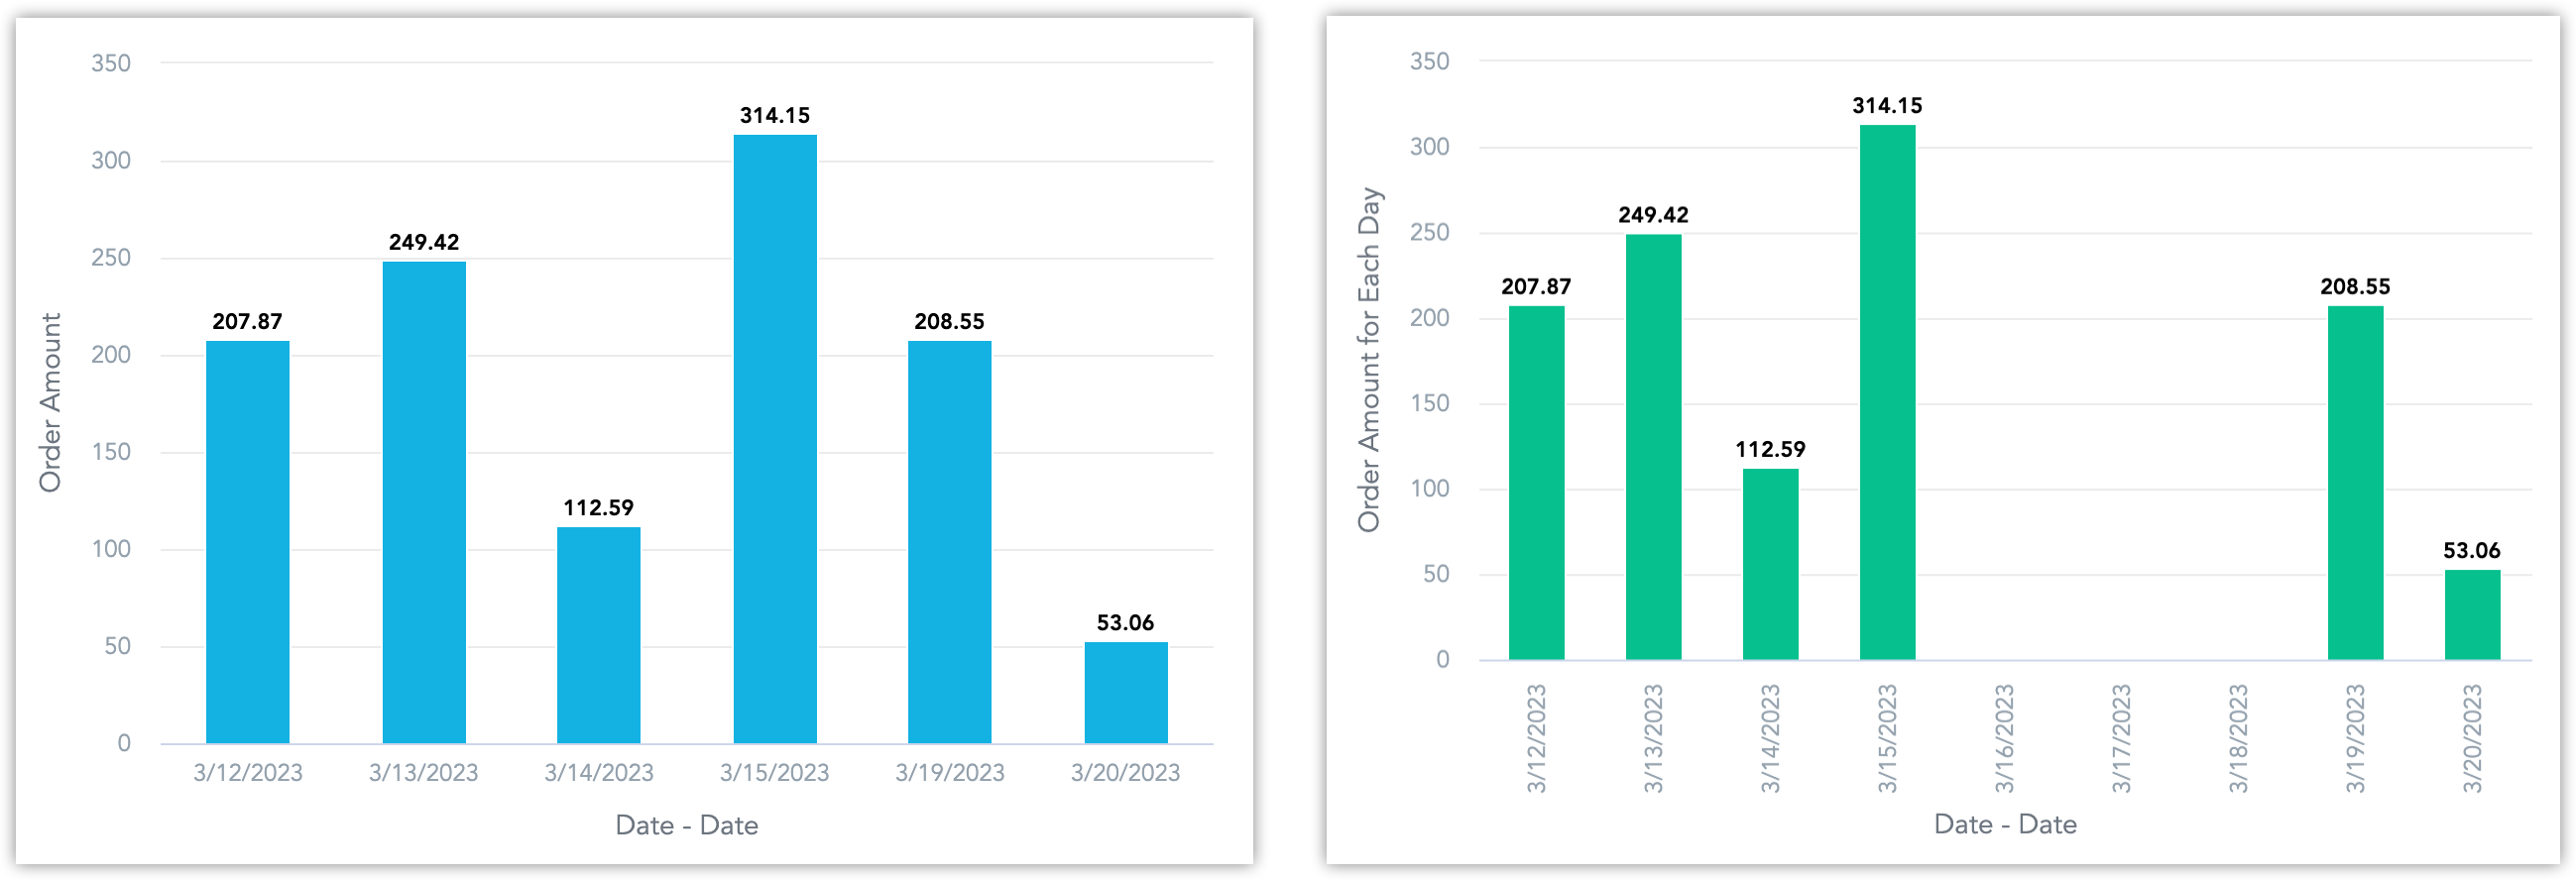
Show Missing Attribute Values in Visualizations
Analytical Designer now enables you to display all data even if the metrics have no data for individual attribute values.
You can select the show missing values option in the View by/Trend by/Rows section in a visualization or create a metric using the new FOR EACH clause to display them automatically.
Learn More:
Support for Databricks
You can now create a Databricks data source and connect to your Databricks database.
Learn More:
Create a Databricks Data Source
Workspace Object Identifiers
We are changing how object IDs work in workspace hierarchies. Objects inherited from parent workspaces will no longer contain prefixes in their object IDs, instead the objects have metadata describing their origin that is accessible via the workspace object API. This should make for a less ambiguous and robust system going forward.
However this could be a breaking change for some of you, especially if you are using:
- Dashboard plugins
- GoodData.UI
- Iframes
We have prepared a short article on what exactly the changes are and how you can address any problems that this change might cause. Please read the article here.
Learn More:
Workspace Object Identification
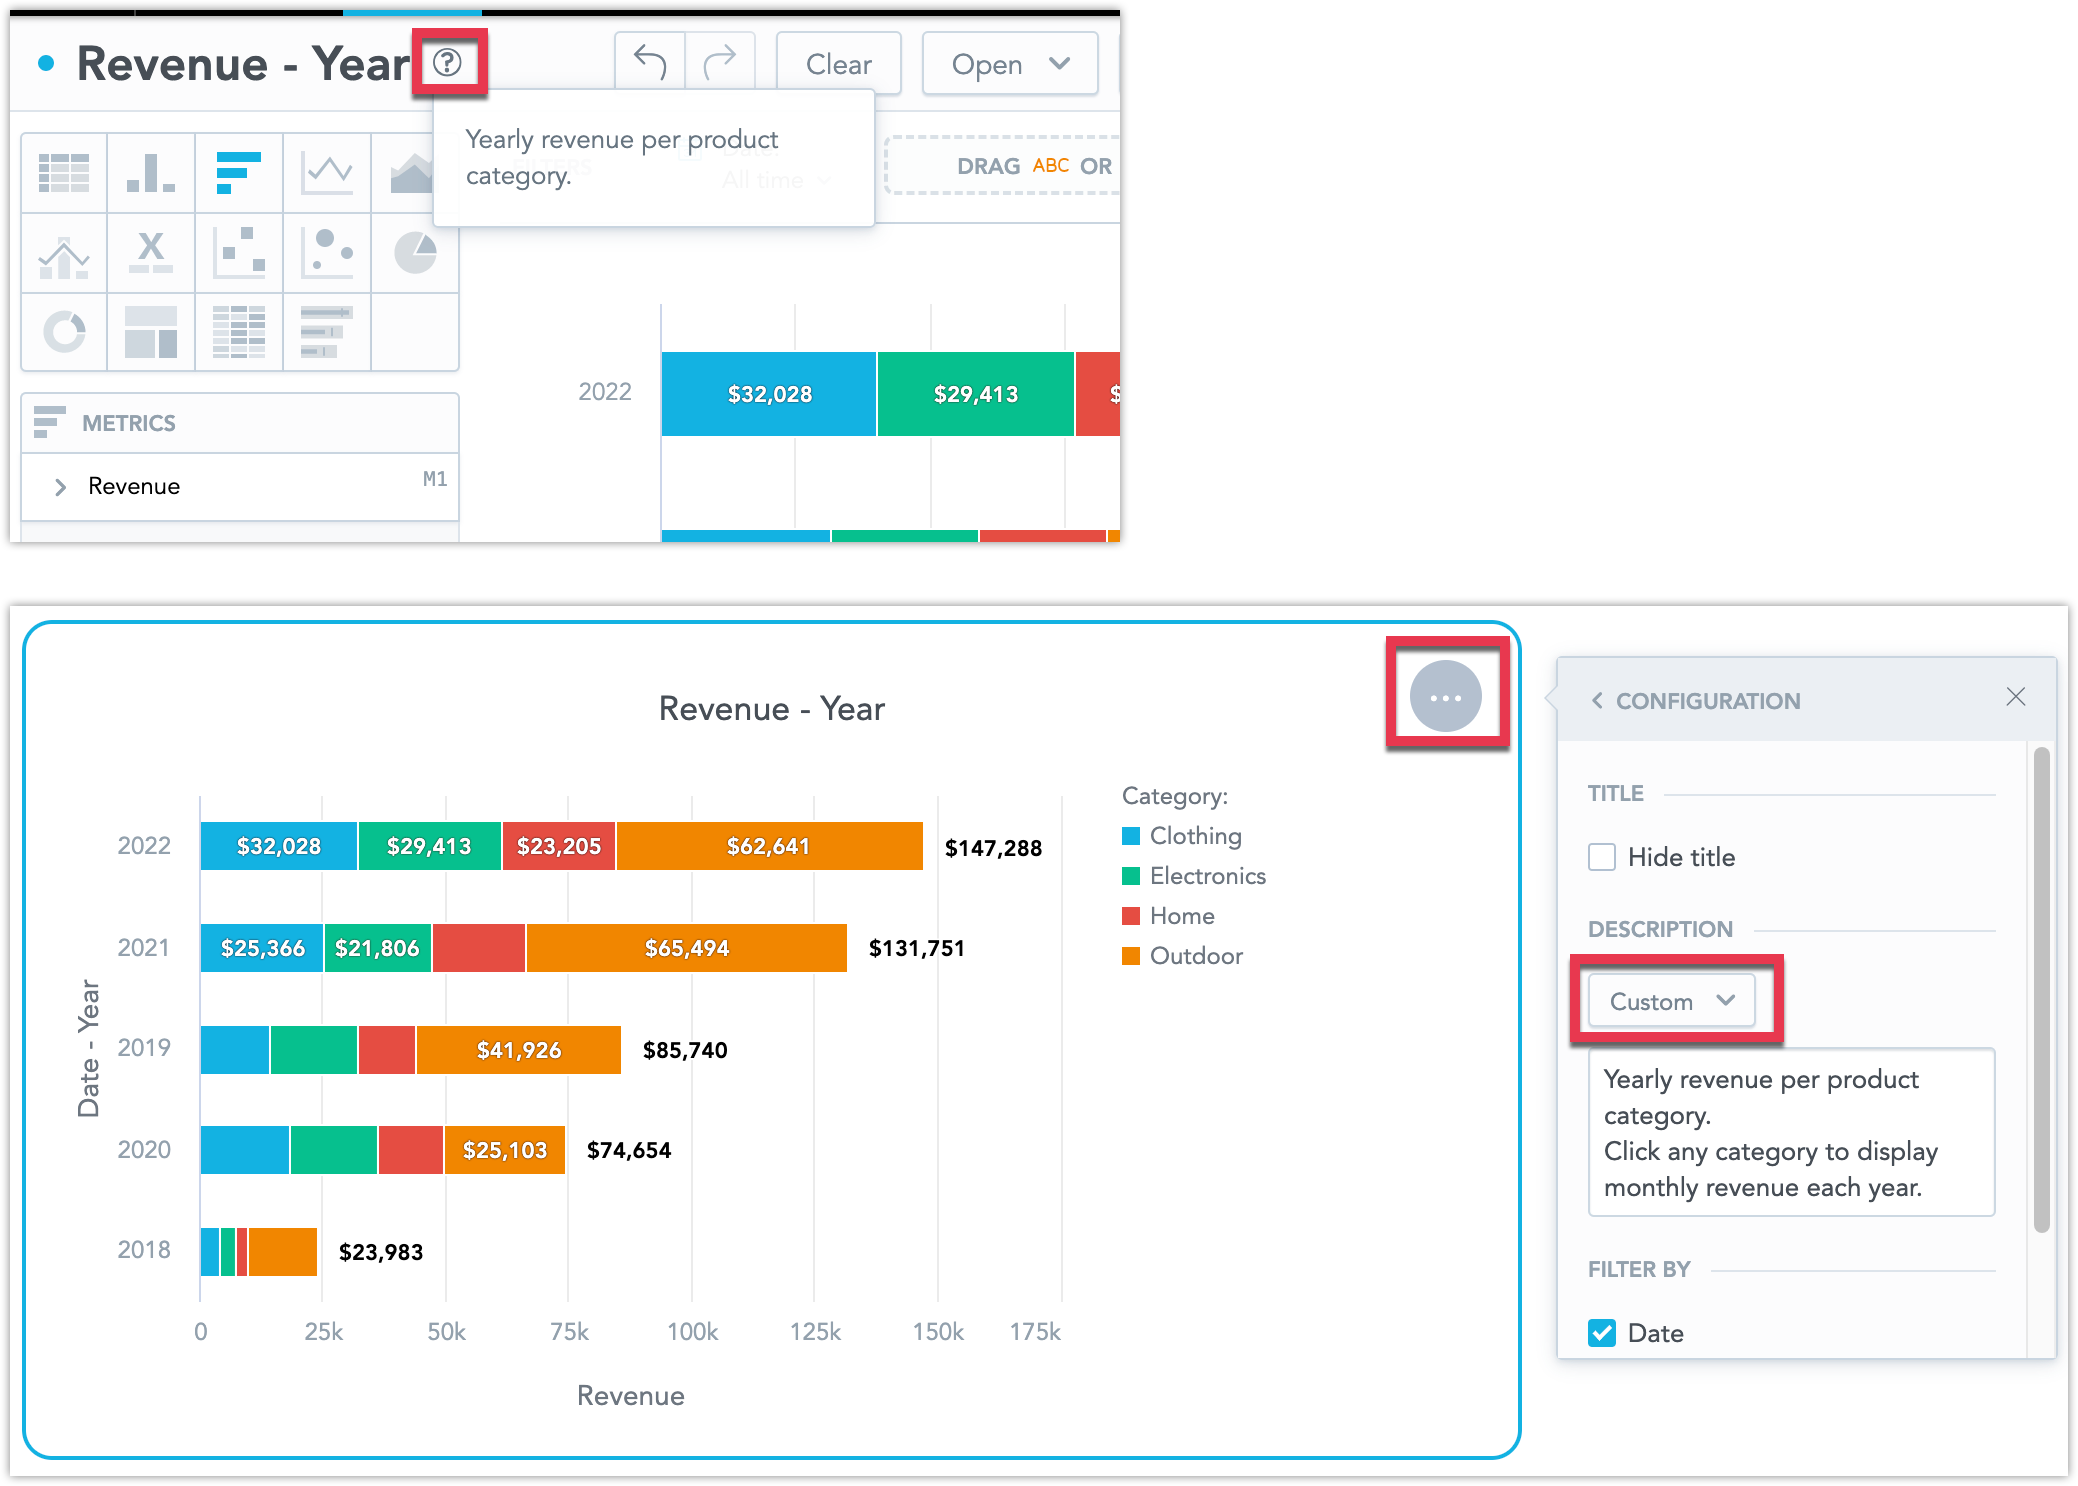
Visualization Tooltips
You can now add descriptive tooltips to your visualization to provide additional context for other users.
On Dashboards, visualizations can display their descriptions as well. For each instance of a visualization on a dashboard, you can customize the description or hide it from displaying.
Learn More:
Manage Visualizations on Dashboards
GoodData.UI Version 8.12
We have released Version 8.12 of GoodData.UI, our powerful library for building analytical applications powered by GoodData.
What's new in GoodData.UI Version 8.12:
- Dashboard plugins in Edit mode
- The Dashboard component provides an end-to-end solution for the creation and consumption of dashboards with a full drag-and-drop editing experience. It allows plugins to be used in Edit mode.
- Descriptions, texts and tooltips for analytical objects of Dashboard
- Insights and dashboard widgets now allow to specify description in the form of tooltips.
- Dashboard permissions management on GoodData Cloud
- Analytical dashboards created in GoodData Cloud are now created as private - visible only to the creator and to all organization and workspace administrators.
- SDK allows granular sharing of any dashboard with selected users and user groups.
- Dashboard permissions can be managed via SPI library and are fully integrated into the Dashboard component.
- Permissions for tabular exports
- Export permissions have been made more granular and the EXPORT permission now includes both EXPORT_TABULAR and EXPORT_PDF.
- Export permissions can also be set individually to allow exports to certain formats only.
- GoodData Cloud date attribute formats
- Improved formatting of date attributes based on locale user setting and defined formatting pattern.
- Extend PDF export for GoodData Cloud
- Dashboards can now be exported to .pdf format.
- Support Geo Pushpin chart on GoodData Cloud
- Allow Geo Pushpin chart on GoodData Cloud.
- Requires valid Mapbox token to be provided for the used workspace.
- Location can be defined as both coordinates joined by `;` or in a separated component property.
-
Other changes
The dashboard header element had its z-index changed from 100 to 6000. For reference the z-indicies of the dashboard overlay elements are as follows:- Overlays in Dashboard component = 5000
- Overlays in Dashboard header component = 6000
- Overlays in Dashboard component in conflict with filter bar = 6000
Python SDK Version 1.3
We have released new Version 1.3, which includes new documentation and some QoL features.
This version is tied to the latest version of GoodData.CN (2.3) and GoodData Cloud.
New features in Python SDK Version 1.3:
- Loading of credentials from a config file
- Cloning of workspaces
- Extended support for SQL-based datasets
Quality of Life changes:
- New documentation
- Moved from readthedocs to Hugo
- New linter
- Updated the style of docstring to comply with google python standards
Breaking changes
- Internat method get_user_groups has renamed to user_groups and now returns List[CatalogUserGroup] instead of List[str]
Bug Fixes
- The expiration of your access or ID tokens should no longer cause you to be logged out prematurely, provided that you enable token refresh on your authentication provider.
- Google BigQuery tables that are named the same as one of their columns should no longer cause any issues when being mapped to GoodData.
- We now display a meaningful error message when you try to create a workspace with a description that is too long.
Upcoming Features and Changes
Dashboard Sharing and Dashboard Permissions
In an upcoming version we are extending our system of permissions to also cover individual dashboards. Newly created dashboards will be private by default, and you get to choose what users and user groups you share the dashboard with. This will be a breaking change for users of GoodData.UI version 8.11 or older. We urge users of GoodData.UI to update to version 8.12 as soon as possible to prevent encountering issues with dashboard permissions.
Learn More: