
This article defines MAQL to calculate skewness and kurtosis that can be used to test the normality of a given data set.
You can try these calculations yourself: Start Your GoodData Analytics Trial — Commitment-Free
In statistics, normality tests are used to determine whether a data set is modeled for normal distribution. Many statistical functions require that a distribution be normal or nearly normal. There are both graphical and statistical methods for evaluating normality:
- Graphical methods include the histogram and normality plot
- Statistically, two numerical measures of shape – skewness and excess kurtosis – can be used to test for normality. If skewness is not close to zero, then your data set is not normally distributed.
To learn about statistical functions in MAQL, see our Documentation.
Now let's look at the definitions of these numerical measures.
SKEWNESS
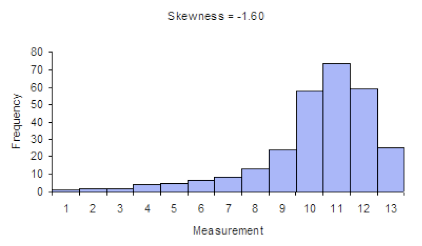
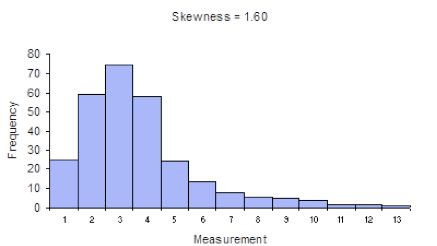
In statistics, skewness is a measure of the asymmetry of the probability distribution of a random variable about its mean. In other words, skewness tells you the amount and direction of skew (departure from horizontal symmetry). The skewness value can be positive or negative, or even undefined. If skewness is 0, the data are perfectly symmetrical, although it is quite unlikely for real-world data. As a general rule of thumb:
- If skewness is less than -1 or greater than 1, the distribution is highly skewed.
- If skewness is between -1 and -0.5 or between 0.5 and 1, the distribution is moderately skewed.
- If skewness is between -0.5 and 0.5, the distribution is approximately symmetric.
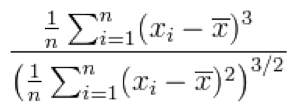
Here, x̄ is the sample mean.
KURTOSIS
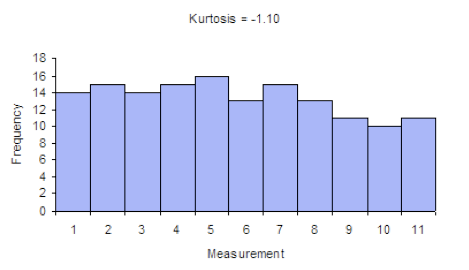
Kurtosis tells you the height and sharpness of the central peak, relative to that of a standard bell curve.
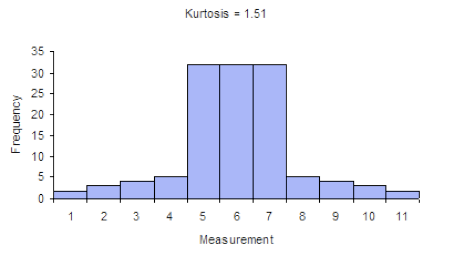
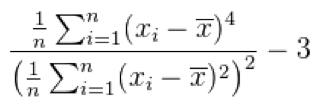
Here, x̄ is the sample mean. The "minus 3" at the end of this formula is often explained as a correction to make the kurtosis of the normal distribution equal to zero, as the kurtosis is 3 for a normal distribution.
Scenario
Suppose we are interested in performing some statistical analysis (for example, outlier detection) to evaluate the performance of sales representatives, and we want to test whether or not employee win rates are normally distributed.
Our data set contains win rates (WinRates) as facts by employee ID (EmpId attribute), as depicted in the following model:

METRIC 1: AVGWINRATE
To find the average of our measurement, or WinRates, we can use MAQL to define the following metric:
SELECT AVG( WinRate ) BY ALL OTHER
The BY ALL OTHER clause is used to avoid any slicing of the amount by any attributes that may be present in the report.
METRIC 2: WINRATESMEANDIFF
We can now use the metric created in Metric 1 to calculate the difference between any given win rate value and the overall average win rate:
SELECT SUM( WinRate - AvgWinRate ) BY EmpId
METRIC 3: SKEWNESSN
Next we can calculate skewness in two parts: numerator ( SkewnessN ) and denominator ( SkewnessD ). Note how we are using the POWER function, aggregating the result and dividing by the number of records.
SELECT (SELECT SUM((SELECT POWER( WinRatesMeanDiff , 3) BY EmpId )))/(SELECT COUNT( EmpId ))
METRIC 4: SKEWNESSD
Similarly, we can calculate the denominator ( SkewnessD ).
SELECT POWER(((SELECT SUM((SELECT POWER( WinRatesMeanDiff , 2) BY EmpId )))/(SELECT COUNT( EmpId ))), 1.5)
METRIC 5: SKEWNESS
Now we can simply divide the numerator (Metric 3) with the denominator (Metric 4) to get the skewness value.
SELECT SkewnessN / SkewnessD
METRIC 6: KURTOSISN
Here again, we calculate the numerator first. Note that the formula is very similar to Metric 3.
SELECT (SELECT SUM((SELECT POWER( WinRatesMeanDiff , 4) BY EmpId )))/(SELECT COUNT( EmpId ))
METRIC 7: KURTOSISD
Next we can calculate the denominator.
SELECT POWER(((SELECT SUM((SELECT POWER( WinRatesMeanDiff , 2) BY EmpId )))/(SELECT COUNT( EmpId ))), 2)
METRIC 8: KURTOSIS
Lastly, to calculate excess kurtosis, we can use the metrics calculated in Metrics 6 and 7.
SELECT ( KurtosisN / KurtosisD )-3
Now you can test your data for normality before performing other statistical analyses.