Solved

Rollup/ Aggregation Wrong

  • 4 February 2023
  • 8 replies
  • 131 views

  • Participating Frequently
  • 6 replies

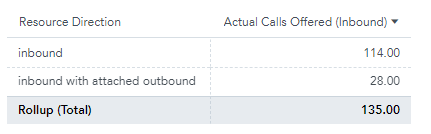
I have a simple table that has an attribute of ‘Resource Direction’ and an attribute of ‘Call Sid’.  I’ve created a metric called Actual Calls Offered, and am trying to select and count all ‘Call Sids’ where Resource Direction = ‘inbound’ OR ‘Resource Direction = ‘inbound with attached outbound’.  The value comes back as 135 records, when I query the database I have 142.  When I add the insight, I get the wrong value of 135, but when I add a row to split the data, the row level data is accurate.  114 + 28 is NOT 135 as shown in the screenshot. 

SELECT COUNT(Call Sid) WHERE (Resource Direction = inbound OR Resource Direction = inbound with attached outbound)

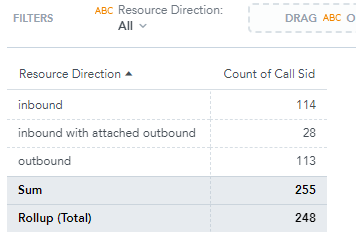
Edit - I tested in insights without using metrics and see the same roll up behavior that matches my metric, but seems accurate when SUM is utilized.


icon

Best answer by Joseph Heun 9 February 2023, 16:11

View original

8 replies

I realize that even though call_sid in my table is not a primary key, it contained duplicate text strings.  This was not intentional, so we’ll fix the plumbing upstream.  But it does pose the question for counting other columns where there is duplicative data.


How would I have built the metric if I wanted to calculate every matching row, including those with duplicate strings?

Userlevel 2

Hello Jeff,


The rollup is an underlying calculation which acts as a smart aggregation and it is calculated as if no attributes had been added to the report. It counts values that have missing references. Whereas the Sum counts what is actually being displayed in the report. That is the reason why Rollup might display a different result to Sum. We have a documentation describing aggregating function in more details here:

https://help.gooddata.com/classic/en/dashboards-and-insights/reports/working-with-tables/aggregate-table-data


Regarding your question, it is really hard to evaluate this without knowing your actual LDM and relations within the datasets. I can see you have provided hyperlinks for the particular attributes. However, we do not have an access into your workspace. Therefore, if you still need further assistance, could you please invite our support user support+novelcx@gooddata.com?

I’ve provided access to support+novelcx@gooddata.com

Userlevel 3

Hi Jeff, 

This is Joseph from the GoodData Support Team, and I’ve been looking into this with Julius as well. I’ve been looking into the insight trying to recreate it, but I see everything working as expected. The sums are correct, but when you use count it will count all available values. Therefore, the easiest thing to do would be to filter out the unwanted values within the insight itself; e.g. filter out the duplicated values you see. 


My issue is a bit different.  The metric is producing 135 versus the expected 142.  I want the raw metric to produce the count of call_sid which is 142, but it’s incorrectly returning 135 unique rows.

Userlevel 3

Hi Jeff, could you please make our support user an admin in the account so we can verify a few things?

Hi Jeff, could you please make our support user an admin in the account so we can verify a few things?

this is done.


It seems that the default behavior due to relational nature of goodata is to return a count distinct, but hoping i’m wrong or there is an easy solution here. :)

COUNT(call_sid) should return 3, versus 2 which is the current behavior.

calls
|id   | length | call_sid|
|---------------------------|
|  1  |    11     |   X00  |
|  2  |    22     |   X00  |
|  3  |    40     |   A12  |

Userlevel 3

The COUNT function returns the number of unique values of an attribute within the given context. Therefore, you will need to use the attributes within the insight to be able to display the numbers you are looking for and not just the metric. I’m sorry that this isn’t the answer you were hoping for.

Reply