Hello,
I’m attempting to plot fees + expenses to date by week to show project expenditure against budget. I’m using the following metric definition to create this specific trend.
SELECT RUNSUM(IFNULL(Time Entry: Fees In Cents/Currency: Base Unit, 0)) + RUNSUM(IFNULL(Expense: Amount In Cents/Currency: Base Unit, 0)) with PF except Date (Shared)
This works as expected when there is data every week, however not all projects will have expenses each week. When there is intermittent data, RUNSUM doesn’t graph correctly. Essentially there are holes in the graph, and as soon as there is data again the graph will continue, but leave a gap. This issue is not corrected by the “ifnull” statement in the metric definition.
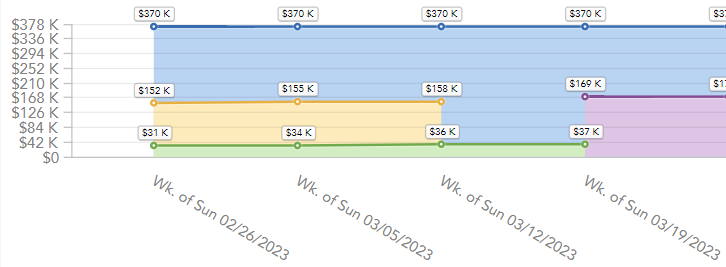
For example, the yellow trend below is fees + expenses to date, the green trend is fees to date. Fees to date is shown correctly because there are fees already entered for the week of Sun 3/19/2023, but there are no expenses yet so the yellow trend line stops at the previous week. I would expect RUNSUM to treat this as a “0” value and graph up to 3/19 like the fees to date trend.
I’m wondering if there is a way to force RUNSUM to see missing data (regardless of the time interval that is being plotted) as an actual “0” value so it will plot correctly even if there isn’t real data entered. Entering $0 expenses is not a viable solution because this would have to be done for many projects each week where there happens to be no normal expenses.
Any assistance is appreciated, thanks
Best answer by Moises Morales
View original