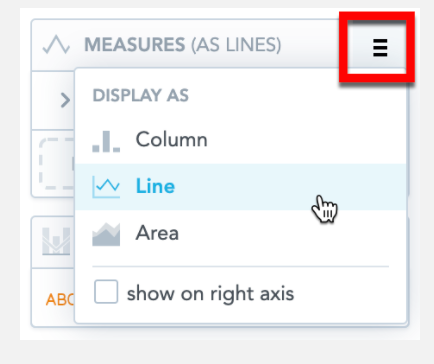
Looking to create a combo chart with a stacked bar chart and a line chart, but so far I am not having any success. Any ideas on how to make this work? My secondary access keeps coming up as another bar chart when I set it to line.
Please make sure you have added the measure under “MEASURES (AS LINES)”. You can also check our documentation on Insight Types for further details on how your data can be displayed on Analytical Designer.
If you are working with combo charts in Pixel Perfect UI, please follow the instructions on this page: https://help.gooddata.com/doc/en/reporting-and-dashboards/reports/working-with-charts/chart-types/combo-chart-in-report-editor
Reply
Login to the community
Sign in with your community account. This is different than your login to your GoodData account. Don't have a community login? Create an account
Enter your username or e-mail address. We'll send you an e-mail with instructions to reset your password.