
How the Platform Works
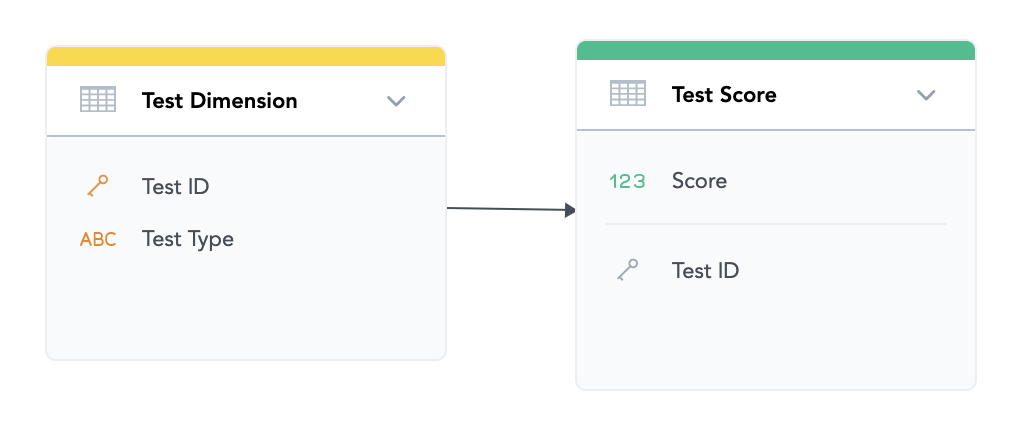
The GoodData platform is designed to perform inner joins between datasets for metric/measure calculation. Here’s an example of what this looks like:
Say we have the following datasets and fields in the LDM:
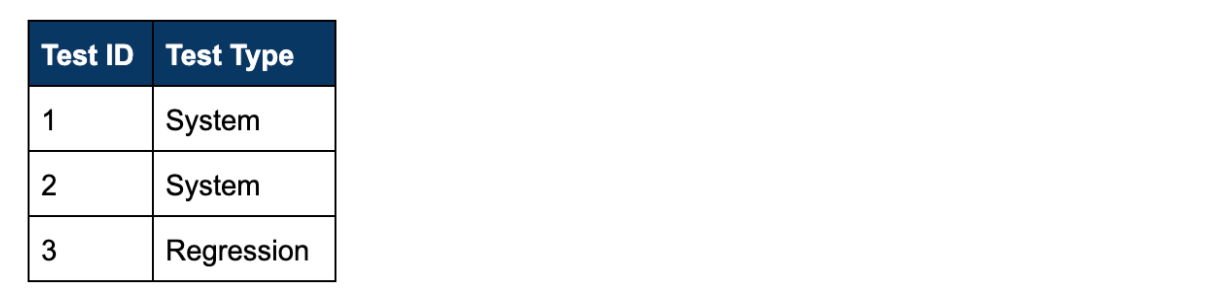
Test Dimension Data Values:
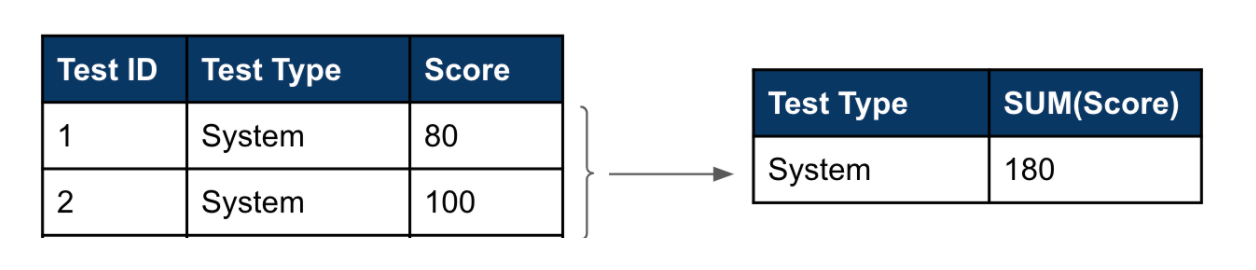
Test Score Data Values:

If we wanted to view all SUM(Score) by Test Type, only Test Types with scores will appear:
If you wanted to view all Test Types, regardless if they have an associated record in the Test Score table, there are two ways to display these values: apply a metric definition change for a single dimension you want to join against or generate the missing rows in the ETL.
Option 1: Metric change for a single dimension
If there is a single dimension you would like to compare the measure against (i.e. Test Dimension), you could modify the measure to simulate a LEFT OUTER JOIN from that dimension to the fact.
Previous Measure:
SELECT SUM(Score)
Modified Measure:
SELECT IFNULL(SUM(Score),0) + 0
The missing records will be populated with a non-null measure value.
Option 2: Generating missing rows in ETL
If there are multiple dimensions you would like to compare the measure against in the same report/insight, you have to populate the missing records in the ETL. The cartesian product of all of the dimensions you would like to slice and dice by will need to be loaded into the fact table. New data volume in the fact table with this missing row generation will increase based on the number of attributes you would like to slice and dice by, the cardinality of each of these attributes, and the original data volume of the fact table.
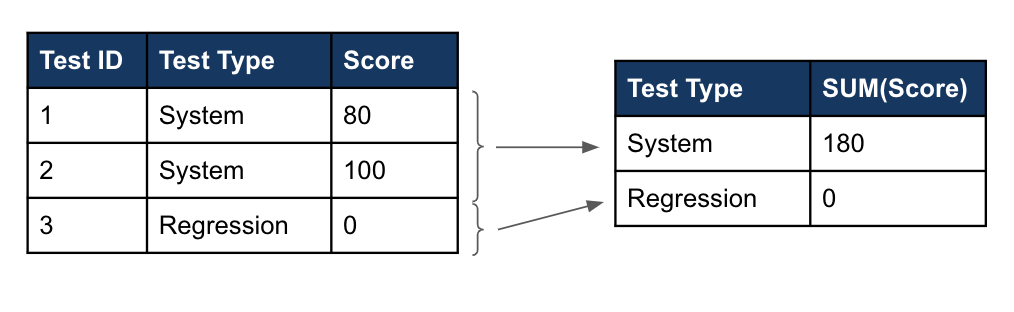
The updated Test Score fact table in our example will be:

Using the original measure of SUM(Score), the report of this measure by Test Type would be the following:
| Test Type | SUM(Score) |
| System | 180 |
| Regression | - |
As another example, let’s add another dimension to the LDM:
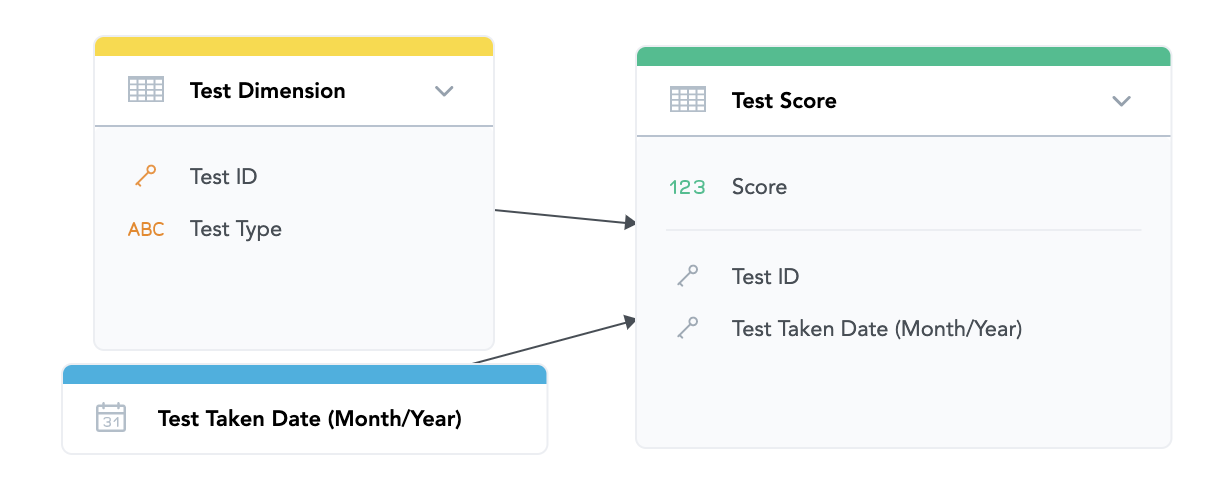
Say the Test Score data values are as follows:
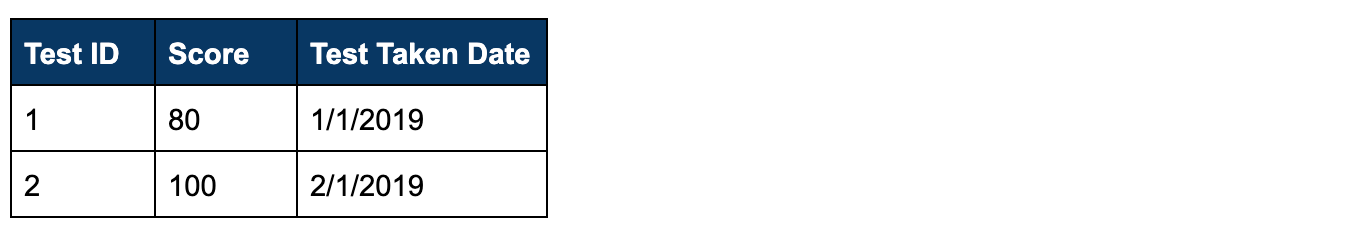
You would like to report on every combination of Test Type and Test Taken Month/Year Date for Q1 of 2019 (Jan, Feb, Mar 2019). Because there are multiple dimensions you would like to compare the scores against (Test Type and Test Taken Date), you will need to populate the missing data in the backend. The updated Test Score data values will now be:
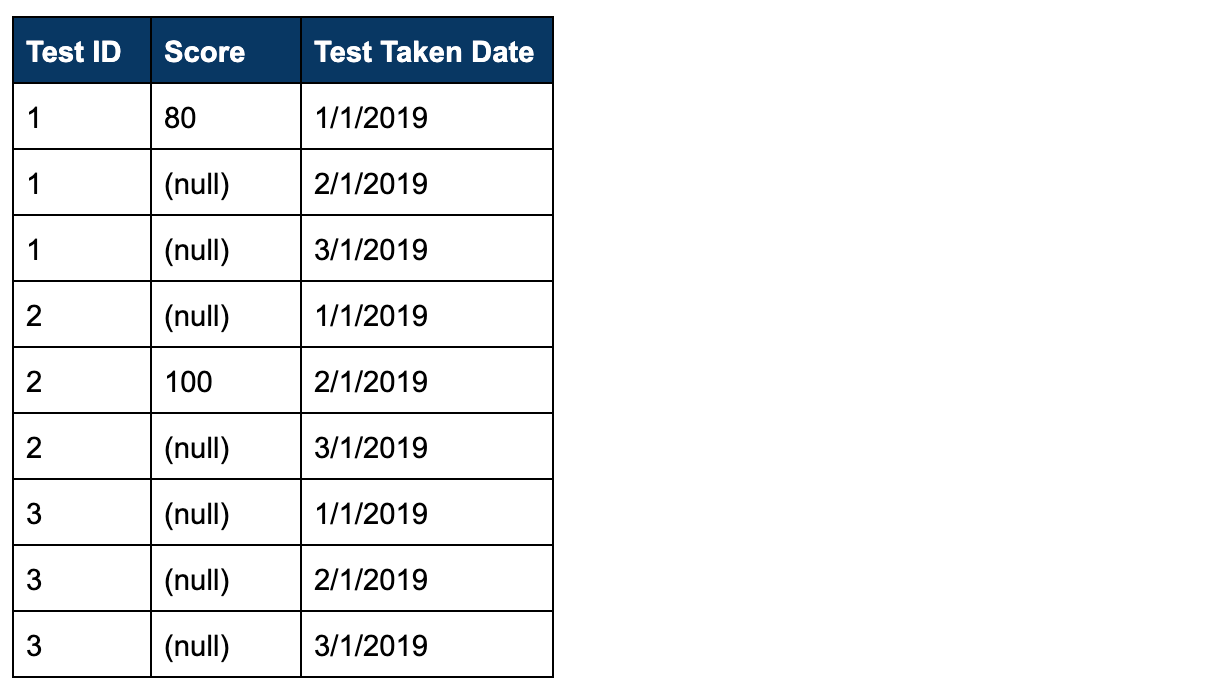
Now, the report of SUM(Score) by Test Type, Test Taken Date where Test Taken Date = Q1 2019 would be the following:
| Test Type | Test Taken Date | SUM(Score) |
| System | 1/1/2019 | 80 |
| System | 2/1/2019 | 100 |
| System | 3/1/2019 | - |
| Regression | 1/1/2019 | - |
| Regression | 2/1/2019 | - |
| Regression | 3/1/2019 | - |