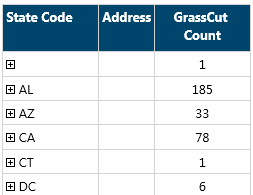
I need to group by state exactly like this. How do I make a table report look like this? When it expands, all the addresses are displayed.
Best answer by Michael Ullock
View originalI need to group by state exactly like this. How do I make a table report look like this? When it expands, all the addresses are displayed.
Best answer by Michael Ullock
View original
The option to "Group By" is only available to Date Dimensions - this is why you cannot see this there.
I would like to mention that it is possible to filter your metrics using many different FILTER EXPRESSIONS. You can filter for specific attribute values using the WHERE CLAUSE. There is also great free tutorial you can take on our MAQL Language, in our GoodData University.
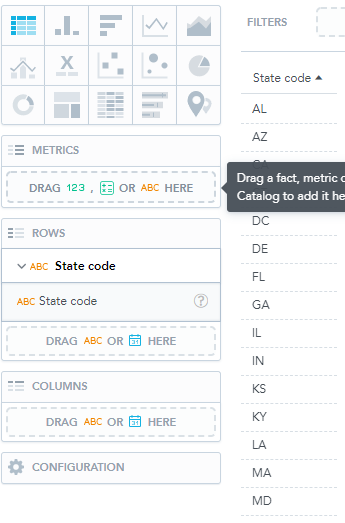
There is no option for me to group by...
https://help.gooddata.com/doc/free/files/en/86793488/104675021/1/1643094869991/vizualization_pivot.png In this screenshot take a look at the date column. It has a ‘group by’. I think that’s what I need; however, instead mine would be grouped by state code. I don’t see this option or any options at all when trying to create a table report.
Please see the following documentation that will help you with creating Table reports:
https://help.gooddata.com/pages/viewpage.action?pageId=86793488
Tables automatically adjust the width of all the columns according to the cell content. The size is calculated according to the content in the header of the column that represents the lowest level of the grouped attributes. More details can be found in the article above.
If the above article doesn't help, can you please provide more details?
Sign in with your community account. This is different than your login to your GoodData account. Don't have a community login? Create an account
Enter your username or e-mail address. We'll send you an e-mail with instructions to reset your password.